


 En
En 8 min read
In today’s fast-moving digital marketplace, timing often matters more than product selection itself. Many sellers fail not because they choose bad products, but because they enter the market too late — after demand has already peaked and competition has intensified.
The difference between average performers and consistently successful operators often comes down to one skill: predicting demand before it becomes obvious.
Search behavior provides one of the most reliable early indicators of consumer intent. Among the available tools, Google Trends stands out as one of the most powerful yet underutilized resources for forecasting seasonal demand patterns.
When used at an advanced level, search trend analysis can help you anticipate emerging seasonal products roughly three months before peak sales periods. This article explores a structured framework for interpreting search data, identifying early signals, and turning raw trend information into actionable forecasting insight.
Why Search Data Predicts Market Demand
Every purchase journey begins with curiosity.
Before consumers buy, they search. Before trends appear on marketplaces, they appear in search queries. And before large-scale demand spikes, small increases in interest quietly emerge in search data.
Search behavior reflects:
- Early consumer awareness
- Problem recognition
- Product discovery
- Comparison research
- Purchase intention
Because searching happens earlier than purchasing, analyzing search patterns allows forward-looking prediction instead of reactive decision-making.
Understanding the Three-Month Demand Window
Seasonal products rarely explode overnight. Most follow a predictable timeline.
Phase 1: Early Curiosity (90–120 Days Before Peak)
Consumers begin exploring ideas and gathering inspiration.
Examples:
- Holiday decorations
- Outdoor equipment
- Seasonal clothing
- Pest-control solutions
Search volumes rise slowly but consistently.
Phase 2: Planning Stage (45–75 Days Before Peak)
Buyers compare options and research specific products.
Search queries become more detailed.
Phase 3: Purchase Surge (0–30 Days Before Peak)
Demand peaks rapidly as purchasing decisions finalize.
By this stage, competition is already intense.
The goal is to identify products during Phase 1.
Why Most People Misuse Google Trends
Many beginners only look for spikes.
This approach fails because spikes represent late-stage demand.
Common mistakes include:
- Searching only trending topics
- Ignoring historical patterns
- Comparing unrelated keywords
- Misinterpreting normalized data
Advanced usage focuses on pattern recognition, not viral moments.
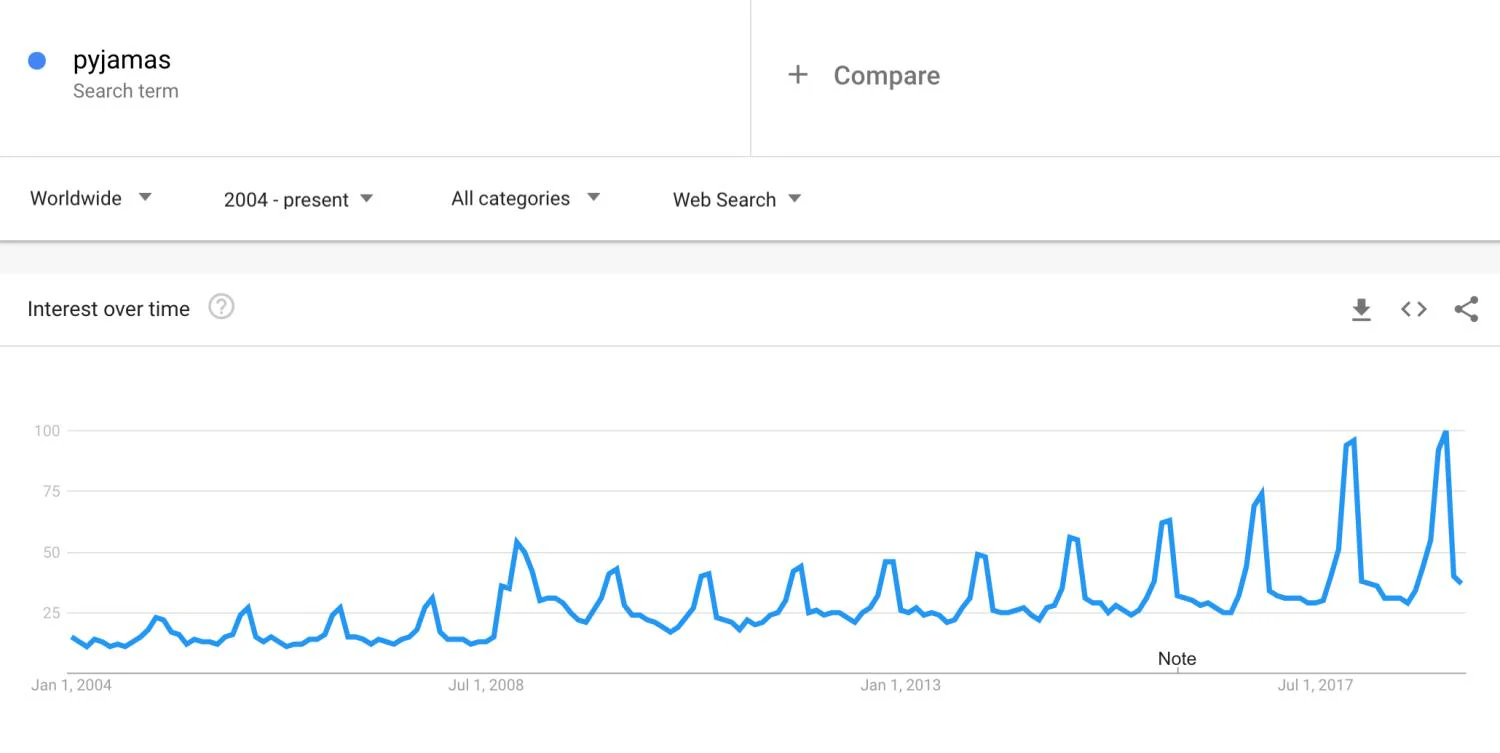
Step 1: Analyze Multi-Year Seasonality Patterns
The first advanced technique is zooming out.
Instead of viewing 12 months of data, analyze five-year trends.
This reveals recurring seasonal cycles.
Look for:
- Annual repeating peaks
- Consistent growth timing
- Stable demand rhythms
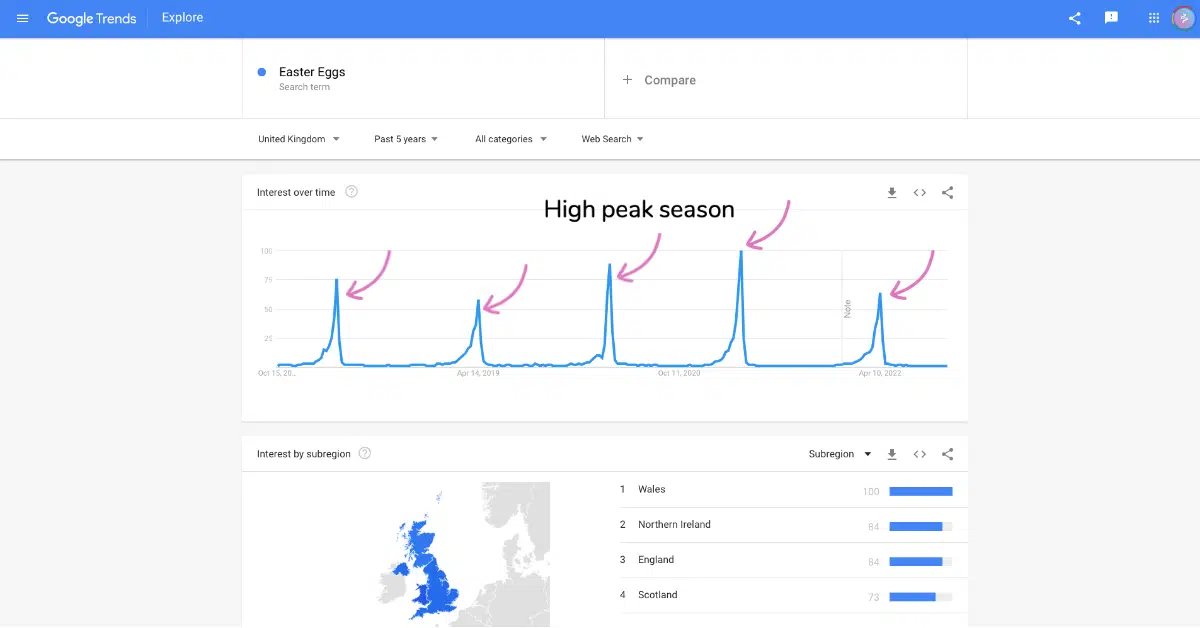
If a keyword peaks every June for five consecutive years, you’ve discovered predictable seasonality.
Consistency matters more than magnitude.
Step 2: Identify the “Early Slope” Signal
The most valuable forecasting signal is not the peak — it’s the initial upward slope.
Three months before peak season, search curves typically show:
- Small upward movement
- Reduced flat periods
- Gradual acceleration
This early slope indicates growing awareness.
Advanced users monitor weekly changes rather than monthly averages to detect subtle momentum shifts.
Step 3: Compare Related Queries for Confirmation
One keyword alone can be misleading.
Instead, analyze clusters of related searches.
Example structure:
- Core product keyword
- Problem-based keyword
- Solution-based keyword
- Accessory keyword
When multiple related searches rise simultaneously, probability of real demand increases dramatically.
This technique filters out random fluctuations.
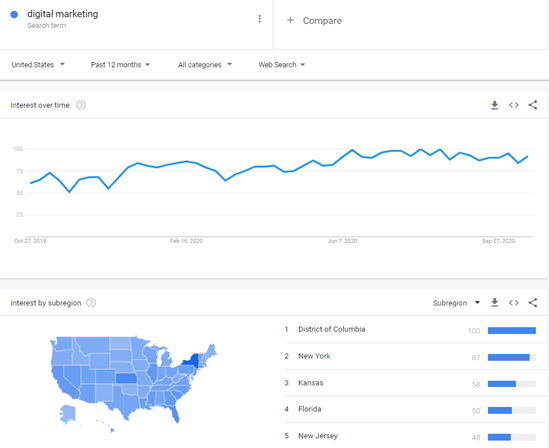
Step 4: Use Regional Interest as an Early Indicator
Geographic data provides powerful predictive insight.
Early adoption often begins in specific regions before spreading nationally.
Watch for:
- Rising interest in warmer climates first
- Urban markets leading rural demand
- Coastal regions showing seasonal shifts earlier
Regional acceleration frequently precedes global growth by several weeks.
Step 5: Detect Demand Expansion Through Query Evolution
Search language changes as markets mature.
Early-stage queries tend to be broad:
- “mosquito solution”
- “summer outdoor lights”
Later queries become specific:
- “UV mosquito lamp outdoor waterproof”
Tracking this evolution helps determine where a product sits within its lifecycle.
Specific searches signal approaching purchasing behavior.
Step 6: Combine Year-Over-Year Comparisons
A powerful forecasting method compares the same timeframe across multiple years.
Ask:
- Is interest higher than last year at the same date?
- Is growth starting earlier?
- Is the slope steeper?
Earlier growth often predicts stronger seasonal performance.
This method helps identify expanding product categories.
Step 7: Identify Pre-Season Search Catalysts
Demand increases are rarely random.
Triggers may include:
- Weather changes
- Media exposure
- Lifestyle trends
- Technological innovation
Understanding catalysts allows prediction beyond raw data interpretation.
For example, unusually warm spring weather may accelerate outdoor product searches.
Step 8: Avoid Misleading Short-Term Spikes
Not all spikes represent sustainable opportunities.
Temporary increases may result from:
- News events
- Viral videos
- Social media moments
True seasonal opportunities display gradual, repeatable growth rather than sudden explosions.
Consistency beats virality for forecasting reliability.
Step 9: Build a Three-Month Forecast Model
An effective forecasting workflow includes:
- Identify recurring seasonal keywords.
- Monitor weekly growth patterns.
- Confirm with related queries.
- Analyze geographic spread.
- Compare historical timelines.
When all indicators align, a product likely enters early demand expansion.
This typically occurs about three months before peak sales.
Step 10: Timing Product Preparation Correctly
Forecasting only matters if followed by action.
Three-month preparation windows allow time for:
- Supplier negotiation
- Inventory planning
- Listing optimization
- Marketing asset creation
- Logistics coordination
Late preparation eliminates competitive advantage.
Real Example: Seasonal Outdoor Products
Outdoor lifestyle products illustrate predictable search cycles.
Typical pattern:
- February–March: curiosity searches begin.
- April–May: research intensifies.
- June–July: purchase peak.
Recognizing early signals enables sellers to enter markets before saturation.
Advanced Keyword Layering Strategy
Instead of relying on a single keyword, build layered tracking groups:
Core Demand Keywords
High-volume product searches.
Problem Keywords
Describe user pain points.
Lifestyle Keywords
Reflect seasonal activities.
Accessory Keywords
Indicate ecosystem expansion.
Tracking multiple layers creates a more accurate forecasting picture.
Recognizing Market Saturation Signals
Search data also warns when opportunities are declining.
Warning signs include:
- Flattening peaks year over year
- Shorter seasonal cycles
- Declining related queries
Entering declining trends leads to excess inventory risk.
Weekly Monitoring vs Monthly Monitoring
Monthly views hide early signals.
Weekly analysis reveals subtle momentum changes.
Small weekly increases compound into major seasonal growth.
Consistency in monitoring is essential.
Using Rising Queries to Discover New Opportunities
The “rising queries” feature highlights rapidly growing searches.
Advanced users analyze:
- Percentage growth rates
- Emerging terminology
- New product variations
These insights often reveal niche opportunities before mainstream adoption.
Forecast Accuracy Through Data Combination
Search data becomes more powerful when combined with:
- Marketplace observations
- Social discussion trends
- Weather forecasts
- Consumer behavior patterns
Multiple signals increase confidence in predictions.
Psychological Drivers Behind Seasonal Searches
Consumer behavior follows emotional cycles tied to seasons.
Examples:
- Spring motivates improvement projects.
- Summer drives outdoor comfort purchases.
- Fall encourages organization.
- Winter inspires indoor lifestyle upgrades.
Understanding psychology strengthens interpretation of search patterns.
Common Forecasting Mistakes
Entering Too Late
Waiting for obvious spikes eliminates advantage.
Ignoring Historical Context
Single-year data lacks predictive reliability.
Overreacting to Viral Trends
Short-lived attention rarely converts into sustained demand.
Tracking Only One Keyword
Markets are ecosystems, not isolated searches.
Creating a Personal Trend Tracking System
Successful forecasters maintain structured tracking routines.
Recommended workflow:
- Track 20–30 seasonal keywords.
- Review weekly.
- Record slope changes.
- Compare year-over-year growth.
- Flag early accelerations.
Consistency builds forecasting intuition over time.
Long-Term Benefits of Predictive Planning
Anticipating demand early leads to:
- Lower sourcing costs
- Reduced advertising pressure
- Better inventory turnover
- Higher profit margins
- Reduced competition stress
Preparation becomes a competitive advantage.
Future Evolution of Search-Based Forecasting
As consumer behavior becomes increasingly digital, search signals grow more predictive.
Emerging developments include:
- AI-assisted trend interpretation
- Real-time behavior modeling
- Cross-platform data correlation
Search analysis will continue evolving into a primary forecasting discipline.
Final Thoughts: Turning Search Behavior into Strategic Foresight
Predicting seasonal winning products is not guesswork. It is a structured process built on understanding how consumer curiosity evolves into purchasing action.
By analyzing long-term patterns, recognizing early growth signals, and interpreting search behavior strategically, it becomes possible to anticipate demand months before it peaks.
The advantage does not come from reacting faster — it comes from seeing earlier.
When search data is interpreted thoughtfully, it transforms from a simple analytics tool into a forward-looking decision framework.
And those who learn to read demand before it becomes obvious are the ones who consistently arrive at the market exactly when opportunity begins — not when it ends.