


 En
En 9 min read
Introduction: The Silent Profit Killer in Independent E-Commerce
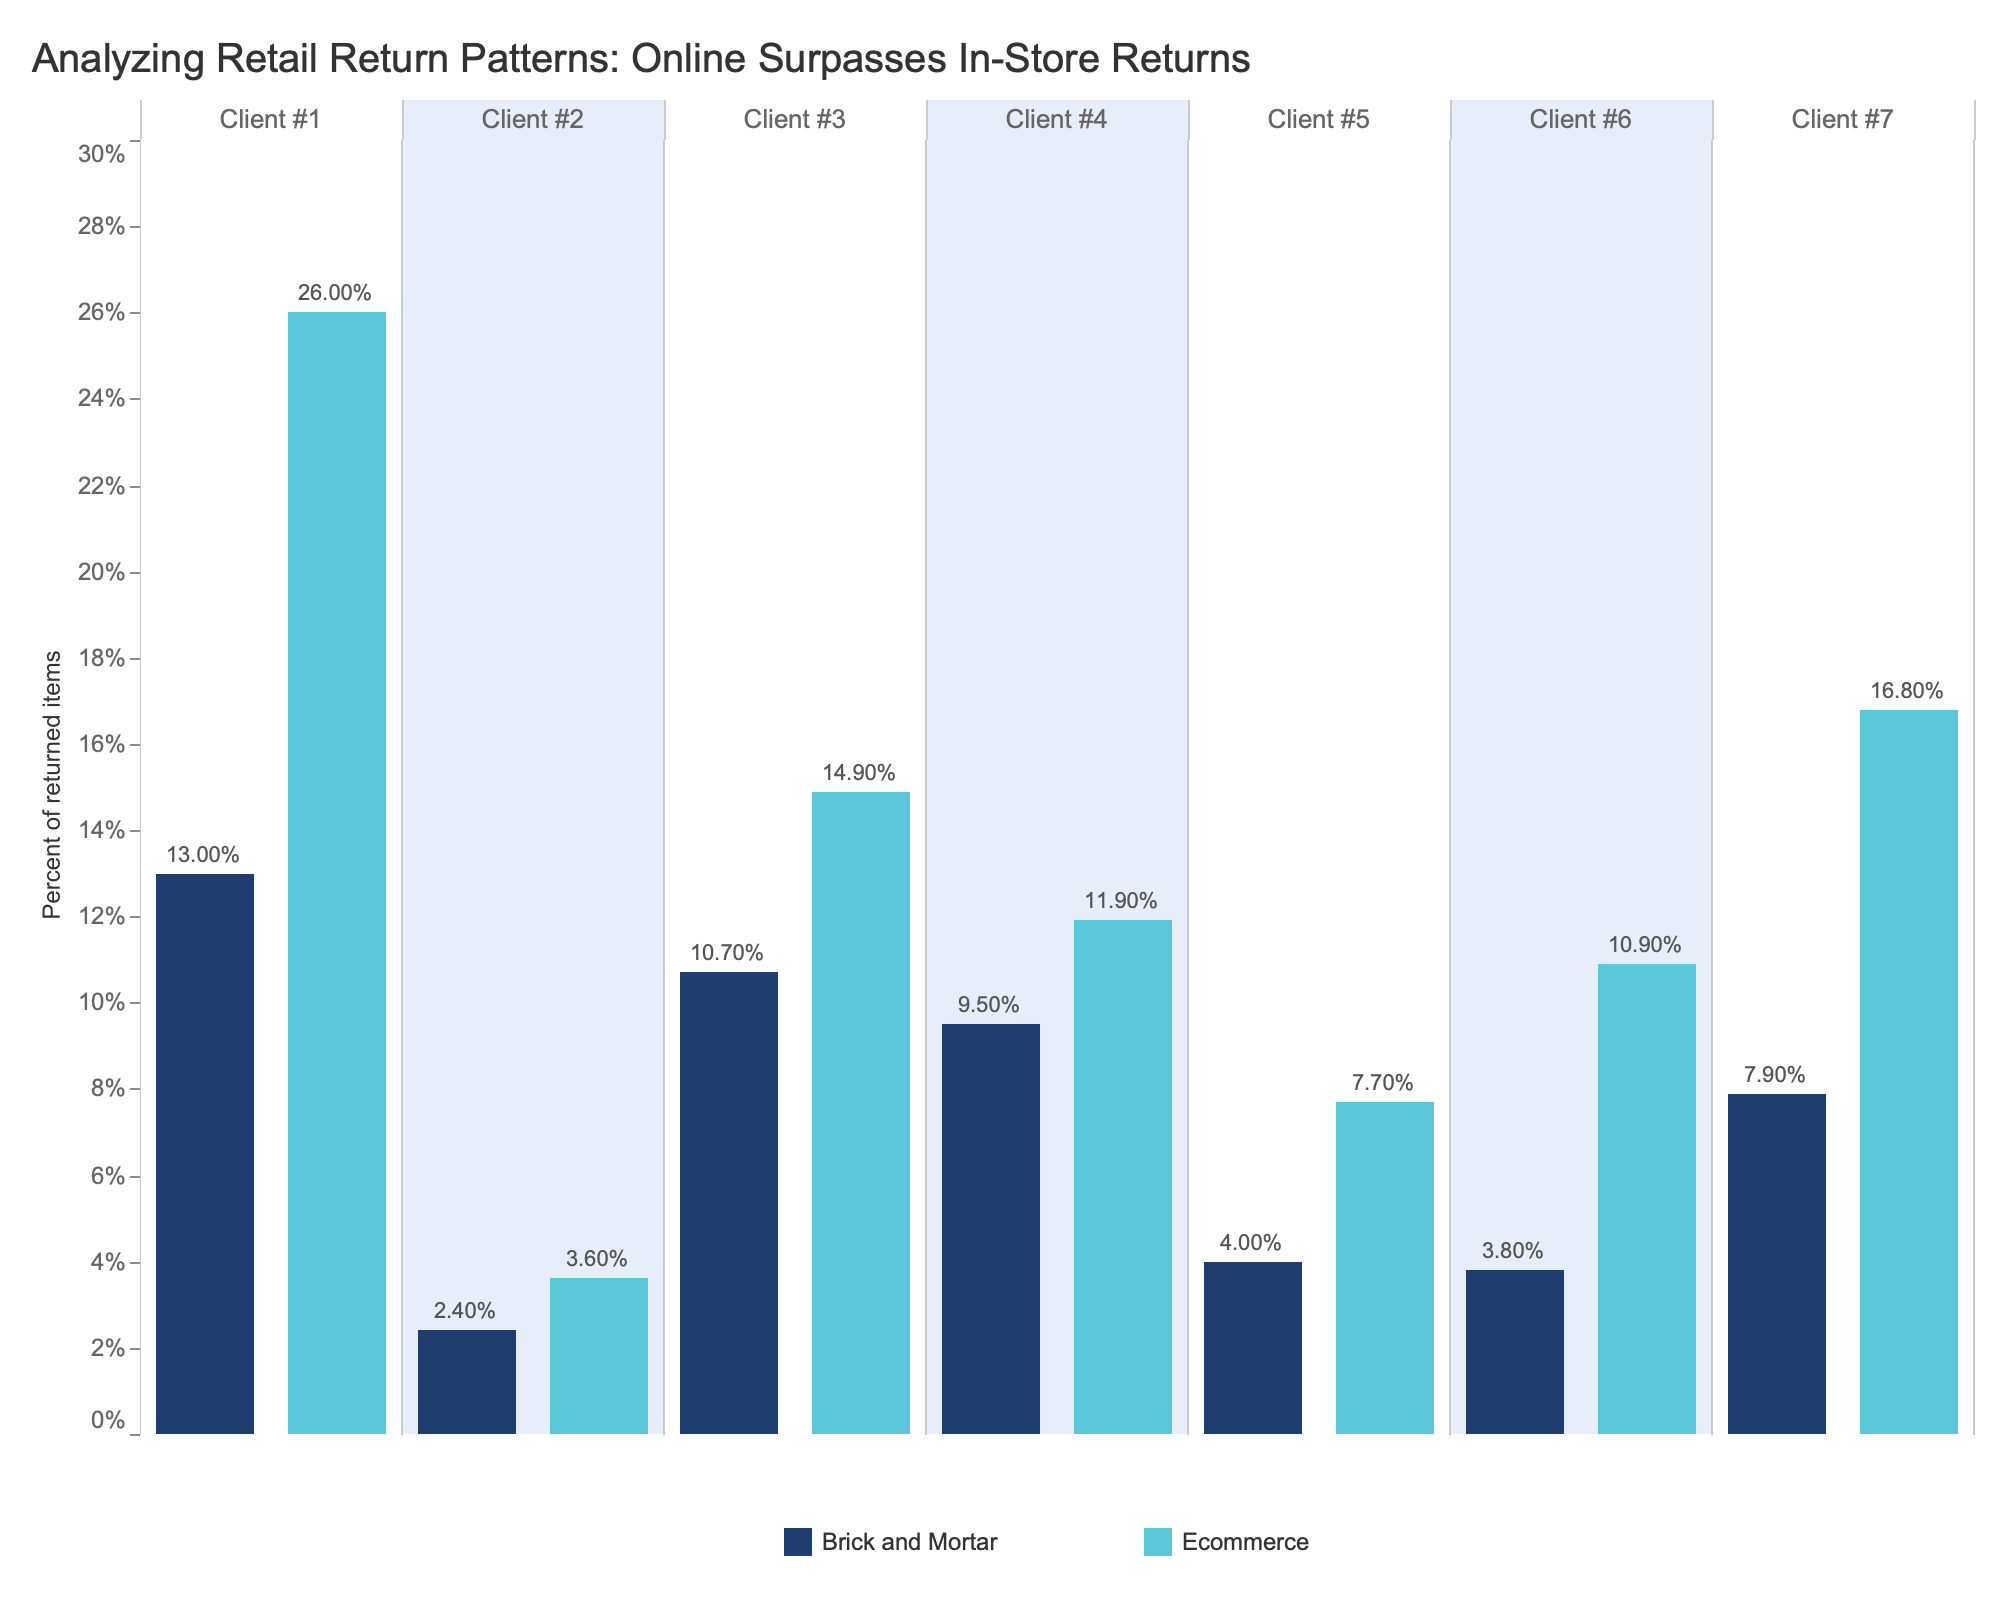
For independent online store owners, few problems are as frustrating—or as expensive—as high return rates. Sales numbers may look impressive on the surface, advertising campaigns may perform well, and traffic may continue to grow, yet profits quietly disappear through refunds, disputes, logistics costs, and damaged customer trust.
Many new sellers assume returns are simply part of doing business online. While some level of returns is unavoidable, experienced independent store operators understand a critical truth: certain product types almost guarantee excessive returns.
In fact, seasoned sellers often refuse to list products with specific characteristics, regardless of how trendy or profitable they appear initially. These products may generate quick sales but create long-term operational headaches that undermine sustainability.
This article explores why return rates become dangerously high, the product features that trigger customer dissatisfaction, and how independent store sellers can identify risky products before investing time and advertising budget.
The Real Cost of Returns (Beyond Refunds)
Most beginners calculate returns only as refunded revenue. In reality, each return triggers multiple hidden costs.
Financial Losses
Returns often include:
-
Refund processing fees
-
Payment gateway charges that are not reimbursed
-
Shipping costs both ways
-
Restocking labor
-
Damaged inventory losses
Even a modest return rate can eliminate profit margins entirely.
Advertising Waste
Customer acquisition costs are rarely recovered when orders are returned. Paid traffic becomes pure expense rather than investment.
Operational Stress
High return volumes lead to:
-
Customer service overload
-
Negative reviews
-
Increased disputes and chargebacks
-
Platform trust score declines
Brand Reputation Damage
Repeated mismatched expectations erode consumer confidence, reducing lifetime customer value.
Why Independent Stores Face Higher Return Risks
Large marketplaces have advantages independent sellers lack.
Limited Brand Trust
Customers buying from unfamiliar brands rely heavily on product descriptions and images. Any mismatch between expectation and reality increases returns.
No Physical Experience
Unlike retail stores, shoppers cannot touch, try, or compare products beforehand.
Aggressive Marketing Trends
Short-form ads often highlight best-case scenarios, unintentionally creating unrealistic expectations.
Product Characteristics That Lead to Extremely High Return Rates
Experienced sellers often recognize warning signs early. Below are the most common product traits associated with excessive returns.
1. Products With Highly Subjective Expectations
Items based on personal taste or perception carry enormous risk.
Examples include:
-
Decorative lighting effects
-
Fashion accessories
-
Home décor colors
-
Beauty-related tools
Customers imagine how products will look in their specific environment. If reality differs even slightly, disappointment follows.
Why Returns Spike
Lighting conditions, room size, camera filters, and screen calibration all affect perception. What looks warm and luxurious online may appear ordinary in person.
2. Size-Sensitive Products Without Universal Standards
Sizing confusion remains one of the largest drivers of returns.
High-risk categories include:
-
Clothing
-
Shoes
-
Wearable accessories
-
Furniture components
-
Storage solutions
Even detailed size charts cannot eliminate interpretation differences.
The Psychology Behind Returns
Customers blame the product—not their measurement error—when fit feels wrong.
3. Products Requiring Assembly or Technical Setup
Complex products increase friction after delivery.
Common issues include:
-
Missing perceived parts
-
Confusing instructions
-
Unexpected tools required
-
Longer setup time than expected
When setup becomes frustrating, customers often choose refunds instead of troubleshooting.
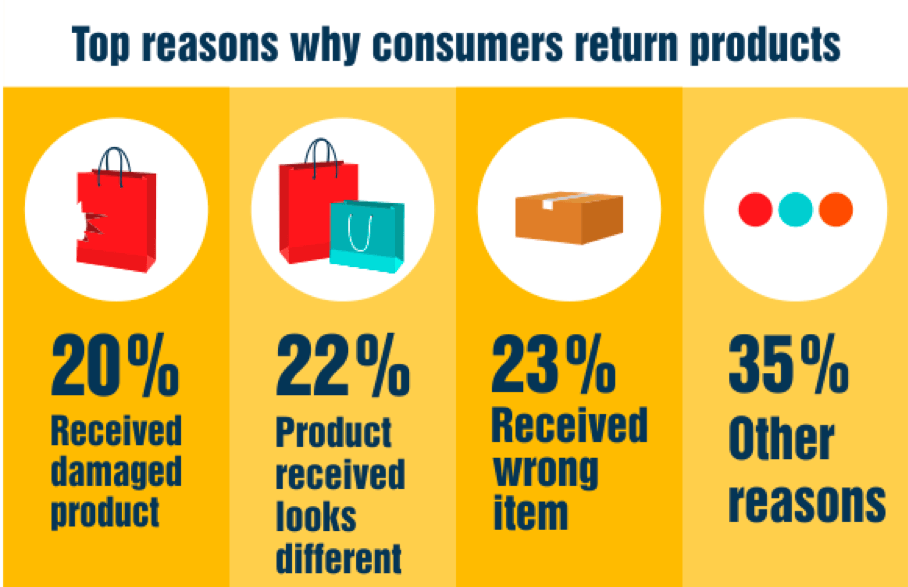
4. Fragile or Easily Damaged Products
Shipping reality rarely matches product photography.
High-risk characteristics:
-
Glass components
-
Thin plastics
-
Sharp corners
-
Heavy items without reinforced packaging
Even small cosmetic damage can trigger returns, especially when products are purchased as gifts.
5. “Expectation Inflation” Products
These items look dramatically better in advertisements than in everyday use.
Typical warning signs:
-
Extreme before-and-after visuals
-
Highly edited promotional videos
-
Unrealistic performance claims
-
Influencer-heavy promotion cycles
Customers feel misled when real-life results appear average.
6. Products With Ambiguous Functionality
If customers must ask, “What exactly does this do?” returns are likely.
Ambiguity creates confusion about:
-
Intended usage
-
Performance limits
-
Compatibility
-
Maintenance requirements
Clear purpose reduces dissatisfaction.
7. Products Dependent on Environmental Conditions
Certain products perform differently depending on external factors.
Examples include:
-
Humidity-sensitive devices
-
Lighting-dependent décor
-
Temperature-reactive materials
-
Wireless signal–dependent gadgets
Customers rarely consider environmental limitations before purchasing.
8. Items Targeting Problem Solving Without Guaranteed Results
Products promising solutions to personal problems carry emotional expectations.
Examples:
-
Cleaning innovations
-
wellness gadgets
-
posture devices
-
home improvement tools
If results vary between users, disappointment leads to returns.
9. Products With Long Delivery Times
Shipping expectations strongly influence satisfaction.
Independent stores using overseas fulfillment may face:
-
Delivery delays
-
Tracking confusion
-
Package anxiety
Even satisfied customers may request refunds simply due to waiting fatigue.
10. Products With High Learning Curves
Products requiring behavioral change or practice often fail commercially.
Customers prefer immediate usability.
If a product requires:
-
Reading manuals
-
Skill development
-
Habit formation
many buyers abandon usage quickly.
The Psychology Behind Returns
Understanding buyer psychology helps sellers predict risk.
Instant Gratification Culture
Modern consumers expect products to work perfectly immediately.
Cognitive Dissonance
After purchase, customers subconsciously look for justification. Any flaw can trigger regret.
Risk-Free Shopping Expectations
Generous return policies across major retailers have conditioned buyers to treat returns casually.
Warning Signs Before Launching a Product
Independent sellers should evaluate products using practical questions:
-
Can expectations vary widely between customers?
-
Does performance depend on user behavior?
-
Could shipping damage easily occur?
-
Is sizing subjective?
-
Are setup instructions complicated?
-
Would customers misunderstand usage?
Multiple “yes” answers indicate elevated return risk.
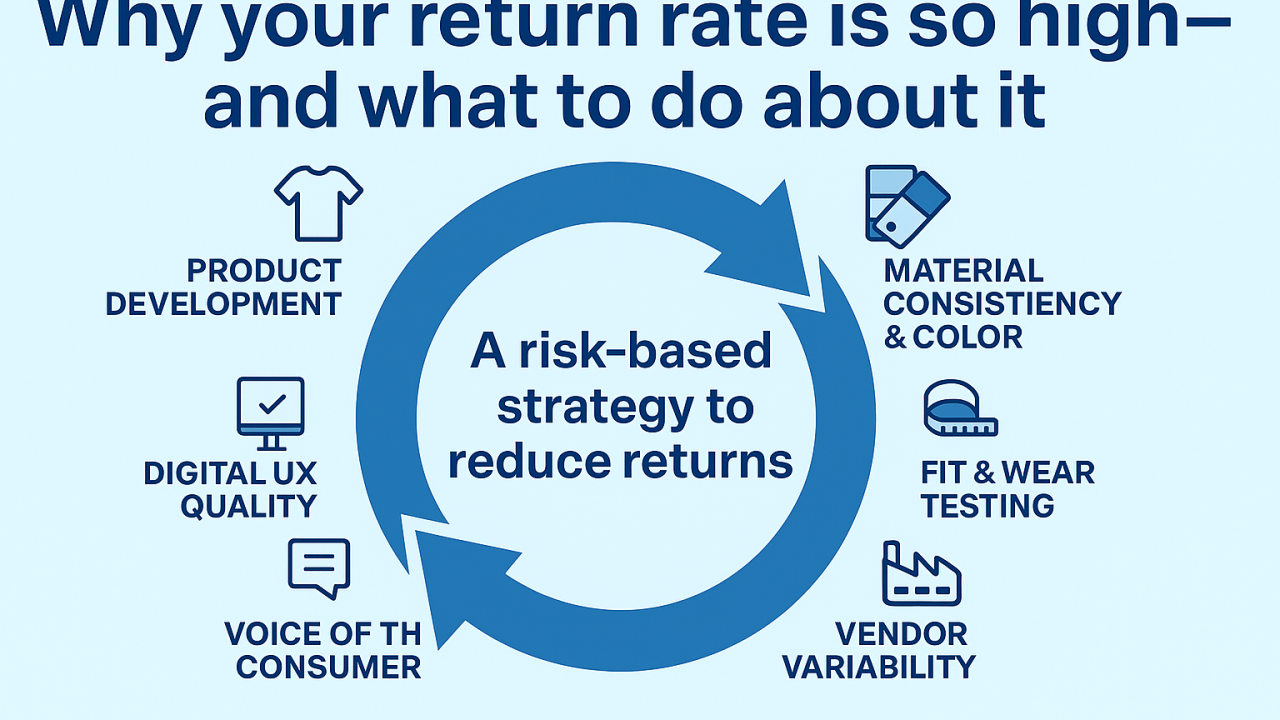
How Experienced Sellers Evaluate Products Differently
Veteran operators prioritize operational stability over short-term trends.
They focus on:
-
Predictable customer satisfaction
-
Clear product value
-
Low misunderstanding potential
-
Durable shipping characteristics
-
Simple usability
Profitability comes from consistency, not viral spikes.
Characteristics of Low-Return Products
Successful independent stores often favor products with opposite traits.
Clear Functionality
Customers instantly understand purpose and benefits.
Durable Construction
Products survive shipping without cosmetic damage.
Universal Fit or Standardization
Minimal sizing confusion.
Immediate Results
Value becomes obvious upon first use.
Low Emotional Expectations
Practical products outperform aspirational ones long term.
Product Description Mistakes That Increase Returns
Even good products fail when presented poorly.
Common issues include:
-
Overpromising performance
-
Missing size references
-
Unrealistic lifestyle imagery
-
Lack of usage clarification
-
Hidden limitations
Transparency builds trust and reduces refund requests.
Photography and Expectation Alignment
Images should reflect real-world experience.
Best practices include:
-
Showing scale with human references
-
Including multiple lighting conditions
-
Displaying realistic environments
-
Avoiding excessive editing
Accuracy converts better customers, not just more customers.
The Role of Customer Education
Returns decrease when buyers know exactly what to expect.
Helpful additions:
-
Demonstration videos
-
Setup walkthroughs
-
FAQ sections
-
Comparison charts
-
Honest limitation explanations
Educated customers become satisfied customers.
Pricing and Return Behavior
Interestingly, extremely low-priced items often experience higher return rates.
Reasons include:
-
Impulse purchases
-
Lower perceived commitment
-
Curiosity-driven buying
Moderate pricing can attract more intentional buyers.
Logistics Strategy Matters
Shipping quality directly impacts return rates.
Key improvements include:
-
Protective packaging
-
Accurate delivery estimates
-
Reliable tracking updates
-
Local warehousing when possible
Logistics is part of product experience.
When High Returns Signal a Product Problem
Patterns sellers should never ignore:
-
Repeated identical complaints
-
Size confusion trends
-
Function misunderstanding
-
Frequent “not as expected” feedback
These signals often indicate product-market mismatch rather than customer error.
Turning Return Data Into Competitive Advantage
Returns provide valuable insights.
Analyze:
-
Reason codes
-
Customer reviews
-
Return timing
-
Geographic trends
-
Marketing source correlations
Smart sellers refine product selection continuously.
The Long-Term Strategy: Fewer Products, Better Products
Many successful independent stores eventually reduce product catalogs.
Why?
Because fewer, reliable products allow:
-
Stronger branding
-
Better customer support
-
Higher margins
-
Lower operational chaos
Quality selection beats quantity expansion.
Future Trends in Independent E-Commerce
As competition increases, sustainability becomes essential.
Emerging trends include:
-
Transparency-focused marketing
-
Expectation-matching visuals
-
Data-driven product validation
-
Customer experience optimization
-
Durable product design emphasis
Return rate management is becoming a defining skill for modern sellers.
Conclusion: The Products You Avoid Define Your Success
In independent e-commerce, success is not determined only by what you sell—but by what you refuse to sell.
High-return products often appear attractive at first glance: trending demand, strong ad engagement, and rapid early sales. Yet hidden beneath those metrics are operational risks capable of destroying profitability.
Experienced sellers learn to recognize dangerous product characteristics early: subjective expectations, fragile construction, unclear functionality, complex setup, and exaggerated marketing promises.
By prioritizing clarity, durability, usability, and realistic customer expectations, independent store owners build businesses that grow steadily rather than fluctuate under refund pressure.
Lower return rates lead to stronger customer trust, healthier margins, and scalable operations. In the long run, avoiding the wrong products is one of the smartest strategies an independent seller can adopt.
Because sustainable e-commerce isn’t about chasing every opportunity—it’s about choosing the right ones.