















 En
En
 21 min read
In today’s digital marketing landscape, companies have access to more customer data than ever before. Every click, impression, search query, social interaction, email open, and purchase event can potentially become part of a detailed customer journey map. With advanced analytics platforms and attribution models, marketers are constantly trying to answer one critical question:
Which advertising channels are truly driving business growth?
However, there is a hidden analytical trap that often leads companies in the wrong direction: survivorship bias.
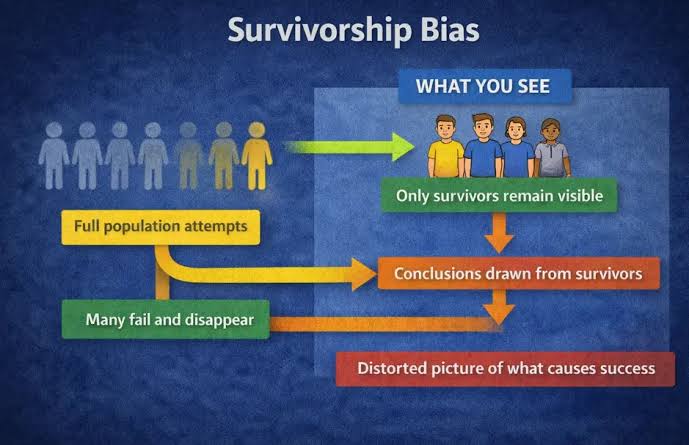
Survivorship bias occurs when organizations focus only on the customers who successfully converted and then analyze the touchpoints those customers experienced, while ignoring the larger group of people who interacted with similar advertising campaigns but never purchased. By looking only at “winners,” marketers may mistakenly believe that certain ads, platforms, or channels deserve more credit than they actually do.
For example, imagine a customer who saw a brand’s social media advertisement, clicked a search ad several days later, received an email promotion, and finally purchased after visiting the company website. A traditional attribution report might conclude that all these channels contributed to the sale.
But what about the thousands of people who saw the same social media ad, clicked the same search campaign, and received the same email — yet never bought anything?
Without analyzing the entire audience, marketers cannot accurately determine whether those touchpoints actually influenced the purchase decision or simply appeared in the journey of people who were already likely to buy.
Modern advertising measurement requires a shift from asking:
“Which channels appear before conversions?”
to asking:
“Which channels create measurable incremental business impact?”
This distinction separates surface-level reporting from true marketing intelligence.
Understanding Survivorship Bias in Advertising Analytics
What Is Survivorship Bias?
The concept of survivorship bias originated from military research during World War II. Analysts examined aircraft returning from missions and noticed bullet holes across their structures. The initial instinct was to reinforce the areas with the most damage.
However, statistician Abraham Wald pointed out a critical mistake: the analysis only included planes that survived.
The aircraft that did not return were missing from the data. The areas without damage on surviving planes might actually have been the most vulnerable locations because hits there prevented the aircraft from coming home.
The lesson was simple:
The data you can see may not represent the complete reality.
The same problem appears frequently in advertising measurement.
A marketing team may analyze thousands of successful customers and discover patterns such as:
- Most buyers interacted with Facebook ads before purchasing.
- Many customers searched Google before conversion.
- High-value customers opened promotional emails.
- Returning customers visited the website multiple times before buying.
The team may conclude:
“Facebook ads, search ads, and email campaigns are responsible for our sales growth.”
But this conclusion may be incomplete because it ignores an essential comparison group:
- People who saw the ads but did not convert.
- People who visited the website but never purchased.
- People who purchased without seeing those advertisements.
Without this comparison, marketers are measuring correlation rather than actual contribution.
The Problem with Traditional Attribution Models
Why Last-Click Attribution Creates a False Sense of Accuracy
For many years, last-click attribution was one of the most common methods used to evaluate advertising performance.
Under this model, the final interaction before a purchase receives 100% of the credit.
For example:
- A customer sees a YouTube advertisement.
- They later read a blog article.
- They receive a promotional email.
- They search the brand name on Google.
- They click a paid search advertisement.
- They purchase.
The last-click model assigns all value to the search advertisement.
This creates several problems.
First, it ignores the earlier interactions that may have influenced customer awareness and consideration.
Second, it rewards channels that capture existing demand rather than channels that create new demand.
Third, it encourages companies to increase spending on channels that appear successful while underinvesting in awareness-building activities.
Search advertising is a common example.
A customer may already know a brand because of months of exposure through video advertising, social campaigns, influencer content, or offline marketing. When they finally search the company name and click an advertisement, the search channel receives the credit.
However, the search ad may simply have collected demand that other channels created.
Multi-Touch Attribution: A Better but More Complex Approach
Multi-touch attribution attempts to recognize that customers rarely make purchasing decisions after a single interaction.
Modern buying journeys often involve multiple stages:
Awareness Stage
Customers discover a brand through:
- Social media advertisements
- Video content
- Display campaigns
- Influencer partnerships
- Industry publications
At this stage, the goal is not immediate conversion. The purpose is creating familiarity and interest.
Consideration Stage
Customers begin researching:
- Website pages
- Product comparisons
- Reviews
- Email newsletters
- Educational content
They evaluate whether the brand fits their needs.
Conversion Stage
Customers take action through:
- Search advertisements
- Retargeting campaigns
- Promotional emails
- Direct visits
A multi-touch model recognizes that each stage may contribute differently.
However, even multi-touch attribution has limitations.
Many companies assume that simply assigning credit across multiple channels solves the measurement problem.
It does not.
The biggest question remains:
Would the customer have purchased anyway without that advertising interaction?
This is where incremental measurement becomes essential.
The Difference Between Attribution and Incrementality
Attribution Shows the Journey
Attribution answers:
“Which marketing touchpoints appeared before a conversion?”
This information is useful because it helps marketers understand customer behavior.
For example:
- 70% of buyers interacted with social media content.
- 55% visited through organic search.
- 40% opened marketing emails.
These insights reveal customer patterns.
However, they do not prove causation.
Incrementality Measures True Impact
Incrementality asks:
“What additional results did advertising create that would not have happened otherwise?”
This is a much harder question.
A campaign may generate thousands of conversions, but if most customers would have purchased without seeing the advertisement, the true incremental value may be much smaller.
For example:
A luxury brand launches a retargeting campaign targeting visitors who abandoned shopping carts.
The campaign generates:
- 10,000 impressions
- 1,000 clicks
- 300 purchases
The marketing team celebrates the results.
But a controlled experiment reveals that customers who did not receive the ads generated almost the same number of purchases.
The real impact of the campaign was not 300 purchases.
The incremental contribution may have been only 30 additional purchases.
Without incrementality testing, the company would dramatically overestimate advertising effectiveness.
Why More Data Does Not Always Mean Better Decisions
Modern marketers often believe that collecting more data automatically leads to better advertising decisions. Companies invest heavily in customer data platforms, analytics tools, tracking systems, and attribution software.
However, data volume alone does not guarantee accuracy.
The biggest challenge in advertising measurement is not collecting information. It is understanding what the information actually represents.
A company may have millions of data points showing:
- Customer impressions
- Website visits
- Ad clicks
- Conversion paths
- Purchase history
- Engagement rates
But if the analysis is built on incomplete assumptions, more data can simply create more confidence in the wrong conclusion.
Survivorship bias is especially dangerous because it often produces convincing reports.
The numbers may look impressive:
“Customers who purchased interacted with five advertising channels before conversion.”
“High-value customers were exposed to our video campaigns 12 times.”
“People who saw our retargeting ads converted at a higher rate.”
All of these statements may be technically correct.
But they do not answer the most important business question:
Did advertising change customer behavior, or did advertising simply appear alongside customers who were already likely to buy?
Accurate measurement requires marketers to separate influence from coincidence.
Creating a Complete Customer Journey View
A reliable multi-touch advertising analysis begins by examining the entire customer population, not only successful buyers.
Include Both Converted and Non-Converted Audiences
Many marketing reports focus exclusively on customers who completed a purchase.
This creates an incomplete picture.
A stronger approach compares multiple groups:
Group One: Converted Customers
These customers:
- Saw advertisements
- Visited websites
- Engaged with content
- Completed purchases
Their behavior reveals possible patterns.
Group Two: Engaged but Non-Converted Customers
These customers:
- Saw advertisements
- Clicked campaigns
- Viewed products
- Added items to carts
- Did not purchase
This group helps identify whether advertising interactions were truly persuasive.
Group Three: Customers With Limited Advertising Exposure
These customers:
- Purchased through direct traffic
- Discovered products organically
- Had little or no advertising exposure
This group provides a valuable comparison point.
By studying all three groups, marketers can understand whether advertising creates additional demand or simply follows existing customer intent.
The Importance of Control Groups in Advertising Measurement
One of the strongest methods for eliminating survivorship bias is using control groups.
A control group represents people who are similar to the target audience but do not receive the advertising treatment being measured.
For example:
A company wants to evaluate whether display advertising increases sales.
Instead of showing ads to everyone, the company divides its audience:
Test Group
Receives display advertisements.
Control Group
Does not receive display advertisements.
After a certain period, the company compares outcomes.
Suppose:
Test group:
- 100,000 people
- 5,000 purchases
Control group:
- 100,000 people
- 4,700 purchases
The advertising campaign generated:
300 additional purchases.
Those 300 purchases represent the campaign’s incremental contribution.
The remaining purchases may have happened regardless.
This approach prevents marketers from claiming credit for customers who were already planning to buy.
Moving Beyond Simple Conversion Metrics
Many advertising teams still rely heavily on basic performance indicators:
- Click-through rate
- Conversion rate
- Cost per acquisition
- Return on ad spend
These measurements are useful, but they can create misleading conclusions.
Clicks Do Not Equal Influence
A customer clicking an advertisement does not automatically mean the advertisement caused the purchase.
Some users click because:
- They already know the brand.
- They were planning to purchase.
- They were comparing prices.
- They received recommendations elsewhere.
A high click-through rate may indicate strong customer interest, but it does not necessarily prove advertising effectiveness.
Conversion Rate Can Hide Audience Quality Issues
Imagine two campaigns:
Campaign A:
- 1 million impressions
- 20,000 conversions
- 2% conversion rate
Campaign B:
- 100,000 impressions
- 5,000 conversions
- 5% conversion rate
At first glance, Campaign B appears more efficient.
However, further analysis reveals:
Campaign A reached new potential customers.
Campaign B mainly targeted existing customers who were already familiar with the brand.
The higher conversion rate does not necessarily mean Campaign B created more value.
Understanding the Role of Different Advertising Channels
A common mistake in multi-touch advertising analysis is evaluating every channel using the same criteria.
Different channels serve different purposes.
Brand Awareness Channels
Examples include:
- Video advertising
- Social media campaigns
- Display advertising
- Influencer partnerships
These channels often influence customers early in the journey.
Their impact may not appear immediately.
A customer may see a video advertisement today but purchase several weeks later after additional research.
If measurement only focuses on immediate conversions, awareness channels will appear ineffective.
Demand Capture Channels
Examples include:
- Paid search advertising
- Shopping ads
- Retargeting campaigns
These channels often capture customers who are already close to purchasing.
They usually produce strong short-term conversion numbers.
However, their performance depends partly on demand created by other channels.
Relationship-Building Channels
Examples include:
- Email marketing
- Customer communities
- Loyalty programs
These channels may generate repeat purchases and improve lifetime customer value.
Evaluating them only by immediate sales ignores their long-term contribution.
Measuring Long-Term Value Instead of Short-Term Results
Another form of survivorship bias occurs when companies evaluate advertising only through immediate purchases.
A customer’s first transaction does not represent the full value of the relationship.
Consider two campaigns.
Campaign A
- Generates 1,000 first-time purchases
- Average order value: $50
- Customers rarely return
Campaign B
- Generates 700 first-time purchases
- Average order value: $70
- Customers continue purchasing for three years
If measurement only considers initial conversions, Campaign A appears stronger.
However, when customer lifetime value is included, Campaign B may generate significantly greater revenue.
A complete advertising evaluation should consider:
- Repeat purchase rate
- Customer retention
- Average lifetime revenue
- Referral behavior
- Brand loyalty
Advertising success is not only about creating transactions.
It is about creating valuable customer relationships.
Common Measurement Mistakes That Reinforce Survivorship Bias
Mistake One: Studying Only Successful Customers
This is the most obvious form of survivorship bias.
A company analyzes buyers and ignores non-buyers.
The result is an incomplete understanding of customer behavior.
Better approach:
Analyze everyone exposed to the marketing effort.
Mistake Two: Giving Too Much Credit to the Final Interaction
The final click before purchase often receives excessive attention.
A customer’s last action may simply represent the final step of a much longer decision process.
Better approach:
Analyze the entire customer journey and evaluate the role of each interaction.
Mistake Three: Ignoring Customers Who Never Converted
Non-converting customers contain valuable information.
They help answer questions such as:
- Did the advertisement fail to persuade?
- Was the audience incorrectly targeted?
- Was the customer not ready to buy?
- Did competitors influence the decision?
Failure data is often as important as success data.
Mistake Four: Optimizing Toward Easy Wins
When companies reward channels based only on direct conversions, teams naturally move budgets toward channels that appear successful.
Over time, this can create an unhealthy balance:
- Too much investment in retargeting.
- Too little investment in brand building.
- Declining new customer acquisition.
- Increasing dependence on existing demand.
Short-term efficiency can sometimes damage long-term growth.
Developing a More Reliable Multi-Touch Advertising Evaluation Framework
Accurately measuring advertising contribution requires more than choosing a better attribution model. Companies need a complete measurement framework that combines customer behavior analysis, experimentation, statistical thinking, and business objectives.
A strong framework should answer four fundamental questions:
- Who was reached by the advertising campaign?
- How did different audiences respond?
- What actions would have happened without advertising?
- What measurable business value did advertising create?
When these questions are addressed together, companies can move beyond surface-level attribution and develop a realistic understanding of advertising performance.
Step One: Define Clear Business Objectives Before Measuring Results
Many advertising measurement problems begin before campaigns even launch.
Companies often collect large amounts of data without clearly defining what success means.
A campaign designed to increase brand awareness should not be judged only by immediate purchases.
A campaign designed to improve customer retention should not be evaluated only through first-time conversions.
Different objectives require different measurement approaches.
Brand Awareness Goals
Important indicators may include:
- Brand recognition
- Search interest growth
- Direct website visits
- Audience engagement
- Customer perception changes
Customer Acquisition Goals
Important indicators may include:
- New customer growth
- Incremental purchases
- Cost per new customer
- Customer quality
- Long-term revenue potential
Retention Goals
Important indicators may include:
- Repeat purchase frequency
- Customer lifetime value
- Loyalty engagement
- Subscription renewal rates
When companies connect measurement methods with business goals, they avoid judging every campaign by the same narrow standard.
Step Two: Combine Attribution Models Instead of Depending on One Method
No single attribution model can perfectly explain customer behavior.
Each method provides a different perspective.
First-Touch Attribution
This model gives credit to the first interaction.
Example:
A customer discovers a brand through a social media advertisement.
The social channel receives the credit.
Advantages:
- Helps identify awareness drivers.
- Shows which channels introduce new audiences.
Limitations:
- Ignores later interactions.
- May overvalue discovery channels.
Last-Touch Attribution
This model credits the final interaction before conversion.
Example:
A customer clicks a search advertisement before purchasing.
The search campaign receives the credit.
Advantages:
- Easy to understand.
- Useful for tracking immediate conversion activity.
Limitations:
- Ignores earlier influence.
- Often favors demand-capture channels.
Linear Attribution
This approach distributes credit equally across all touchpoints.
Example:
A customer interacts with five channels.
Each receives 20% of the credit.
Advantages:
- Recognizes multiple interactions.
- Simple to implement.
Limitations:
- Assumes every interaction has equal impact.
- May not reflect actual customer decision-making.
Time-Decay Attribution
This model gives more credit to interactions closer to conversion.
Advantages:
- Recognizes that later interactions may influence decisions.
- Useful for shorter purchase cycles.
Limitations:
- May undervalue early awareness activities.
Data-Driven Attribution
This approach uses statistical analysis and machine learning to estimate channel impact.
Advantages:
- Can identify complex patterns.
- Uses actual customer behavior.
Limitations:
- Requires high-quality data.
- Results depend on model accuracy.
The strongest marketing organizations do not blindly trust one attribution model. They compare multiple perspectives and validate conclusions through experiments.
Step Three: Use Incrementality Testing to Reveal Real Advertising Value
Incrementality testing is one of the most powerful tools for overcoming survivorship bias.
Instead of asking:
“Did customers who saw ads purchase?”
It asks:
“Did seeing ads cause more customers to purchase than would have purchased naturally?”
Several approaches can help answer this question.
Randomized Controlled Experiments
The most reliable approach is a randomized experiment.
Customers are randomly divided into groups:
- Advertising exposure group
- Non-advertising control group
Because the groups are similar, differences in outcomes are more likely caused by advertising.
This method is widely considered one of the strongest ways to measure true marketing impact.
Geographic Testing
When individual-level testing is difficult, companies can compare different regions.
For example:
Region A receives increased advertising investment.
Region B maintains normal advertising levels.
After the campaign period, sales changes are compared.
This approach is especially useful for:
- Retail businesses
- Local services
- Large consumer brands
Holdout Testing
A portion of the audience is intentionally excluded from advertising.
For example:
A company runs email campaigns to 95% of customers while keeping 5% as a control group.
The company then compares purchasing behavior.
This helps identify whether emails create additional sales or simply reach customers who were already likely to purchase.
The Role of Artificial Intelligence in Advertising Measurement
Artificial intelligence is transforming how companies analyze marketing performance.
However, AI does not automatically eliminate measurement problems.
If the underlying data contains survivorship bias, AI may simply produce more sophisticated versions of the same mistake.
High-quality AI measurement requires:
- Complete customer data
- Proper experimental design
- Balanced datasets
- Clear business objectives
When used correctly, AI can help marketers:
Identify Hidden Customer Patterns
Machine learning models can analyze thousands of customer journeys and discover relationships between:
- Advertising exposure
- Customer behavior
- Purchase timing
- Lifetime value
Predict Customer Value
AI can estimate which customers are likely to become valuable long-term buyers.
This allows companies to optimize campaigns toward quality rather than quantity.
Improve Budget Allocation
Instead of asking:
“Which channel generated the most conversions?”
AI-powered systems can help answer:
“Which channel creates the greatest incremental business value?”
This represents a major shift in advertising strategy.
Building a Culture of Better Marketing Decisions
Technology alone cannot solve measurement problems.
Companies must also develop better analytical habits.
A mature marketing organization encourages teams to ask:
- What evidence supports this conclusion?
- What data might be missing?
- Are we analyzing successful customers only?
- Would these results exist without advertising?
- Are we measuring short-term performance or long-term value?
These questions help prevent overconfidence.
The goal of measurement is not to prove that a campaign worked.
The goal is to understand reality as accurately as possible.
Sometimes the answer will show that a campaign performed exceptionally well.
Sometimes it will reveal that a popular channel contributed less than expected.
Both outcomes are valuable.
Accurate measurement helps companies invest resources where they create the greatest impact.
The Future of Multi-Touch Advertising Measurement
The future of advertising analytics will move away from simple attribution reports and toward integrated business intelligence systems.
Several trends will shape this evolution.
Greater Focus on Privacy-Friendly Measurement
As consumer privacy expectations increase, companies will rely less on individual tracking and more on:
- Aggregated data analysis
- First-party customer relationships
- Experimental measurement
- Predictive modeling
The ability to understand customer behavior without excessive tracking will become a competitive advantage.
More Emphasis on Incremental Growth
Marketing teams will increasingly evaluate:
- Additional customers created
- Additional revenue generated
- Additional customer value produced
rather than simply counting conversions.
Integration Between Marketing and Business Strategy
Advertising measurement will become less isolated.
Marketing decisions will connect directly with:
- Revenue planning
- Customer experience
- Product strategy
- Market expansion
The question will no longer be:
“How many sales did this advertisement receive credit for?”
Instead, companies will ask:
“How much sustainable business growth did this advertising activity create?”
Conclusion: Measure What Advertising Truly Creates, Not What It Happens to Touch
Multi-touch advertising has transformed the way companies understand customer journeys. However, without careful analysis, marketers can easily fall into the trap of survivorship bias.
Looking only at customers who converted creates an incomplete picture.
Giving automatic credit to every touchpoint creates exaggerated results.
Optimizing based on misleading data can lead companies to waste budgets and miss important growth opportunities.
The solution is not abandoning attribution.
The solution is improving it.
By combining comprehensive audience analysis, control groups, incrementality testing, customer lifetime value measurement, and thoughtful data interpretation, businesses can discover the true contribution of every advertising investment.
The most successful marketers are not those who find the channel that appears most successful.
They are those who understand why customers make decisions, measure what truly changes behavior, and invest based on evidence rather than assumptions.
In a world where advertising budgets continue to grow and customer journeys become increasingly complex, rejecting survivorship bias is not just a measurement improvement.
It is a foundation for smarter, more sustainable business growth.