


 En
En 8 min read
In e-commerce, product research is the difference between steady growth and unpredictable revenue swings. Some products skyrocket for three months and disappear. Others grow quietly and sell consistently for years. If you’re building a sustainable online business — especially in niches like home décor, UV lamps, mosquito traps, or custom eyewear — understanding the difference between a seasonal bestseller and an evergreen product is critical.
One of the most powerful free tools for identifying product demand patterns is Google Trends.
Most sellers use it at a surface level: type in a keyword, glance at the chart, and make a quick judgment. But advanced users go much deeper. They analyze multi-year cycles, geographic shifts, breakout queries, and cross-comparison overlays to separate temporary hype from durable demand.
This comprehensive guide explores advanced strategies for using Google Trends to distinguish seasonal spikes from long-term winners — so you can make smarter inventory, advertising, and product development decisions.
Why the Seasonal vs. Evergreen Distinction Matters
Before diving into advanced techniques, let’s clarify why this distinction is so important.
Seasonal Bestsellers
-
Experience predictable annual spikes
-
Often tied to weather, holidays, or events
-
Require inventory timing precision
-
Can produce intense short-term revenue
-
Risk stockouts or overstock
Examples:
-
Mosquito traps in summer
-
Space heaters in winter
-
Graduation gifts in spring
Evergreen Products
-
Maintain relatively steady demand year-round
-
May grow gradually over time
-
Provide predictable revenue flow
-
Reduce inventory volatility
Examples:
-
Reading glasses
-
Blue light blocking eyewear
-
Home air purifiers
Misidentifying a seasonal product as evergreen can lead to excess inventory. Mislabeling an evergreen product as seasonal can cause missed scaling opportunities.
Google Trends helps you see the difference — if you know how to interpret it correctly.
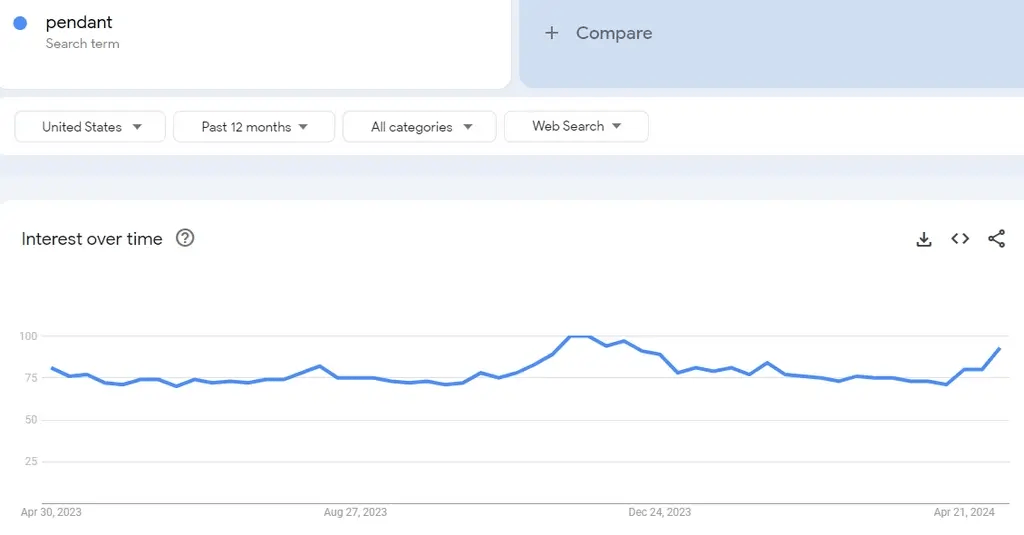
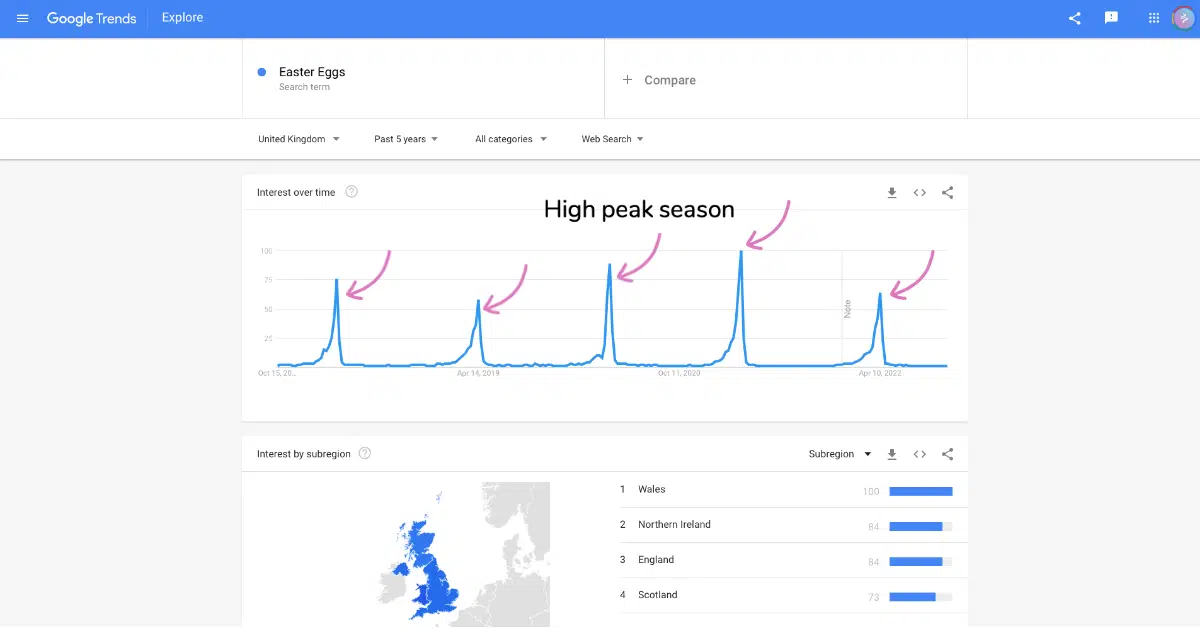
Step 1: Expand the Time Range Beyond 12 Months
Most beginners analyze only the past 12 months. That’s a mistake.
The first advanced rule: Always switch to 5-year view or longer.
In Google Trends:
-
Select “Past 5 years”
-
Or choose “2004–present” for deeper insight
Why this matters:
A 12-month chart might show steady growth — but that growth could simply reflect entering peak season. A 5-year chart reveals recurring cycles.
Identifying Seasonal Patterns
If the graph shows:
-
Sharp spikes every June and July
-
Deep drops every December
-
Repeating annual rhythm
You are likely looking at a seasonal product.
If the graph shows:
-
Consistent moderate baseline
-
Minor fluctuations
-
No extreme annual troughs
The product is more likely evergreen.
Step 2: Measure Baseline Stability
The key difference between seasonal and evergreen demand isn’t the peak — it’s the baseline.
Ask:
-
Does search interest drop near zero off-season?
-
Or does it maintain at least 40–60% of peak levels?
Seasonal products typically:
-
Spike dramatically
-
Collapse quickly
Evergreen products:
-
Maintain a stable floor
-
Show smoother curves
Advanced sellers calculate a “Baseline Ratio”:
Lowest annual point ÷ Highest annual point
If the ratio is:
-
Below 0.3 → Likely seasonal
-
Above 0.5 → Likely evergreen or semi-evergreen
This simple metric clarifies ambiguity.
Step 3: Compare Related Keywords
Search behavior varies by phrasing.
For example:
-
“UV mosquito trap”
-
“Mosquito lamp”
-
“Bug zapper”
-
“Indoor mosquito killer”
Overlay multiple keywords in Google Trends.
If all variations spike simultaneously each summer, that confirms seasonality.
If one variation remains stable year-round, that could indicate a specific evergreen segment within a seasonal category.
Advanced strategy:
Identify sub-keywords that smooth out the main keyword’s volatility.
Step 4: Analyze Geographic Distribution
Click into “Interest by Subregion.”
Seasonal products often correlate strongly with climate.
Example:
-
Mosquito-related searches spike in Florida, Texas, and Louisiana during summer.
-
Minimal activity in colder northern states during winter.
Evergreen products tend to show:
-
Broader geographic distribution
-
Less extreme regional fluctuation
Geographic spread often signals long-term stability.
Step 5: Examine “Rising Queries” and “Breakout” Signals
Scroll to “Related Queries.”
If you see:
-
“Breakout” labels
-
Sudden 500%+ increases
This may indicate trend-driven hype rather than stable demand.
Questions to ask:
-
Is the breakout tied to a viral video?
-
Is it linked to a news event?
-
Is it influenced by social media trends?
Temporary cultural moments can distort search data.
Evergreen products typically show gradual increases rather than explosive breakouts.
Step 6: Cross-Validate with External Data
Google Trends shows relative search interest — not sales.
Advanced analysis involves cross-referencing with:
-
Marketplace bestseller rankings
-
Advertising cost fluctuations
-
Historical pricing trends
-
Social media mentions
If a product spikes in Trends but shows inconsistent sales history, it may be hype-driven.
If search interest rises gradually over multiple years alongside consistent product reviews and stable pricing, it likely reflects durable demand.
Step 7: Identify Hybrid “Seasonal Evergreen” Products
Not all products fall neatly into one category.
Some are evergreen with seasonal amplification.
Example:
An air purifier may sell year-round but spike during wildfire season.
In Google Trends, this appears as:
-
Stable baseline
-
Predictable seasonal lifts
These hybrid products are often ideal because:
-
They generate consistent income
-
They provide peak-season scaling opportunities
Understanding this nuance allows better inventory planning.
Step 8: Watch Multi-Year Growth Slopes
Zoom out to 10+ years if data allows.
Look for:
-
Long upward slope
-
Plateau
-
Decline
A product may appear evergreen in the short term but be declining long-term.
Advanced sellers analyze:
-
Is this niche saturated?
-
Is demand increasing annually?
-
Is interest shrinking due to technology shifts?
Long-term direction matters more than short-term spikes.
Step 9: Adjust for External Events
Major global events can distort data.
For example:
During lockdown periods, home-related product searches surged across many categories.
That spike doesn’t necessarily represent sustainable demand.
When analyzing:
-
Exclude anomaly years if necessary
-
Compare pre- and post-event patterns
-
Identify normalization trends
Context prevents misinterpretation.
Step 10: Use Category Filtering
In Google Trends, you can filter by category.
This reduces noise from unrelated searches.
For example:
If researching “lamp,” filter under “Home & Garden.”
Without filtering, results may include:
-
Music references
-
Brand names
-
Unrelated meanings
Advanced filtering increases accuracy.
Step 11: Analyze Search Intent Shifts
Look beyond raw interest.
Examine related queries for:
-
“Buy”
-
“Best”
-
“Review”
-
“Near me”
Seasonal products often show transactional spikes.
Evergreen products show steady buying intent year-round.
Understanding search intent helps forecast revenue stability.
Step 12: Build a Demand Forecasting Model
Advanced users export Trends data and:
-
Chart year-over-year comparisons
-
Identify growth rate percentages
-
Calculate volatility index
Products with:
-
Low volatility
-
Steady year-over-year growth
Are strong evergreen candidates.
High volatility with sharp peaks suggests seasonal inventory risk.
Practical Case Comparison
Let’s imagine two product types:
Product A:
-
Massive spikes every June–August
-
Near-zero interest December–February
-
Highly regional
Product B:
-
Stable moderate interest
-
Slight uptick during back-to-school season
-
Broad national distribution
Product A is seasonal.
Product B is evergreen with mild seasonality.
Understanding this distinction guides:
-
Inventory levels
-
Marketing budgets
-
Cash flow planning
-
Product line expansion
Common Mistakes When Using Google Trends
-
Relying only on 12-month data
-
Ignoring baseline stability
-
Misinterpreting breakout spikes
-
Failing to compare multiple keywords
-
Overreacting to short-term viral interest
Avoiding these mistakes separates amateurs from strategic operators.
Strategic Business Implications
If Product Is Seasonal:
-
Prepare inventory 60–90 days before peak
-
Increase ad spend before spike
-
Liquidate before off-season
-
Consider complementary off-season products
If Product Is Evergreen:
-
Focus on consistent branding
-
Invest in long-term customer retention
-
Optimize lifetime value
-
Expand variations
Understanding product type shapes entire business strategy.
Advanced Insight: Emotional vs. Functional Demand
Seasonal products often connect to:
-
Weather
-
Holidays
-
Events
Evergreen products often address:
-
Daily needs
-
Ongoing problems
-
Lifestyle improvements
If demand ties to recurring events, expect seasonality.
If tied to permanent pain points, expect durability.
Final Thoughts: Data Over Hype
In e-commerce, excitement is dangerous.
A single viral month can create the illusion of sustainable success.
Advanced use of Google Trends reveals deeper truths:
-
Repeating annual cycles
-
Stable demand floors
-
Geographic concentration
-
Long-term trajectory
Seasonal bestsellers can generate explosive profits — if timed correctly.
Evergreen products build steady empires — if nurtured patiently.
The key isn’t choosing one over the other.
It’s recognizing which is which.
When you learn to interpret demand patterns accurately, you gain control over forecasting, inventory, and growth.
In the long run, clarity beats hype — and data beats guesswork.