


 En
En 8 min read
In the world of eCommerce and dropshipping, few platforms provide as much publicly visible market data as AliExpress. Every day, millions of buyers interact with products, leave feedback, generate sales history, and create behavioral signals that sellers can analyze.
For many beginners, product research starts and ends with one number: order volume.
A listing showing 10,000 orders feels safe. A product with only 50 orders feels risky. The assumption seems logical — more orders must mean a better product.
Yet experienced sellers know that raw order numbers rarely tell the full story.
Behind every order count lies a deeper set of signals about demand stability, competition intensity, lifecycle timing, and profit potential. Sellers who learn to interpret these signals correctly gain a significant advantage when selecting products.
This article explores three core metrics derived from AliExpress data that reveal what order volume actually means — and how to identify real opportunities hidden behind the numbers.
Why Order Volume Alone Is Misleading
Order volume is attractive because it simplifies decision-making. It appears objective and easy to compare.
However, it suffers from several limitations:
- Orders accumulate over time rather than reflecting current demand.
- Viral products inflate numbers temporarily.
- Mature products may show large totals despite declining interest.
- High sales often attract intense competition.
A product with 20,000 historical orders may actually be slowing down, while a product with 300 recent orders could be rapidly emerging.
Understanding context is more important than reading totals.
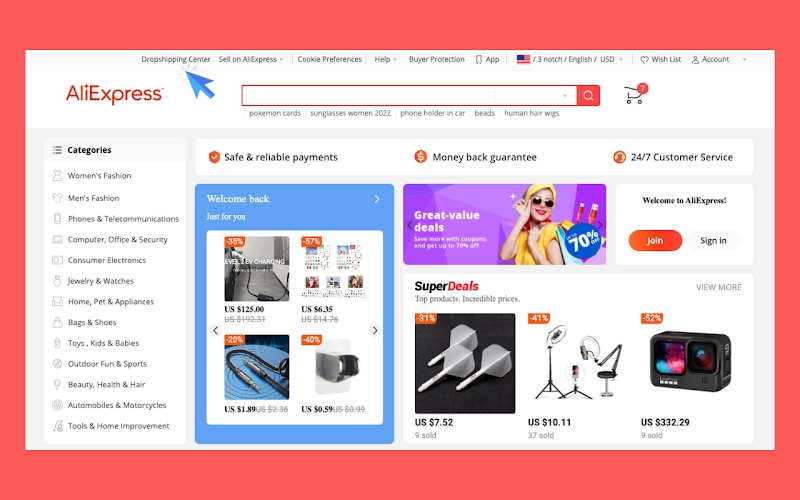
The Data Advantage of AliExpress
Unlike many wholesale platforms, AliExpress exposes multiple layers of buyer interaction data:
- Total orders
- Reviews and ratings
- Store history
- Pricing trends
- Shipping activity
- Variation performance
When analyzed together, these signals reveal market dynamics normally hidden from retailers.
Successful product research transforms raw marketplace activity into interpretable patterns.
The First Core Metric: Order Velocity
What Is Order Velocity?
Order velocity measures how fast orders are increasing, not how many exist overall.
It answers a critical question:
Are people buying this product right now?
A listing with 5,000 orders accumulated over three years may be weaker than one gaining 500 orders in two weeks.
How to Estimate Order Velocity
AliExpress does not display daily sales directly, but velocity can be inferred using:
- Review timestamps
- Recent feedback frequency
- “X orders in last X days” indicators (when available)
- Review page pagination speed
If dozens of new reviews appear every few days, active demand is likely strong.
Why Velocity Matters More Than Volume
High velocity suggests:
- Current market interest
- Active advertising traffic
- Growing awareness
- Algorithmic promotion
Low velocity despite high total orders often signals market saturation or decline.
Practical Example
Two products:
Product A
- 15,000 orders
- Few recent reviews
Product B
- 800 orders
- Continuous daily feedback
Product B often represents the better opportunity because demand momentum still exists.
The Second Core Metric: Review-to-Order Ratio
Understanding the Hidden Conversion Signal
Not every buyer leaves a review. However, review behavior tends to remain statistically consistent across categories.
By comparing reviews to total orders, sellers can estimate:
- Customer satisfaction
- Product authenticity
- Real shipment volume
- Listing quality
Calculating the Ratio
Basic formula:
Review Count ÷ Total Orders
Typical patterns:
- 3–8% ratio: healthy engagement
- Below 2%: possible fake orders or poor satisfaction
- Above 10%: highly engaged buyers or strong product experience
What the Ratio Reveals
A strong review-to-order ratio often indicates:
- Accurate product expectations
- Reliable supplier fulfillment
- Consistent quality control
A weak ratio may suggest:
- Refund-heavy orders
- Drops in buyer satisfaction
- Artificial order inflation
Reading Between the Lines
Some sellers artificially increase order counts through promotions or internal traffic. Reviews, however, require real buyer effort.
This makes review activity a more trustworthy performance indicator than orders alone.
The Third Core Metric: Supplier Stability Index
Why Supplier Behavior Matters
Many sellers focus entirely on product demand while ignoring supplier consistency.
Yet dropshipping success depends heavily on fulfillment reliability.
Supplier instability can destroy even strong product opportunities.
Indicators of Supplier Stability
Key signals include:
- Store age
- Consistent product catalog
- Response behavior
- Shipping option stability
- Rating trends over time
Tracking Rating Movement
A supplier maintaining steady ratings across months demonstrates operational maturity.
Sudden rating drops may indicate:
- Logistics problems
- Quality inconsistency
- Inventory shortages
Repeat Listing Patterns
Reliable suppliers often:
- Update listings gradually
- Maintain pricing consistency
- Improve product media over time
Unstable sellers frequently create new listings repeatedly to escape negative history.
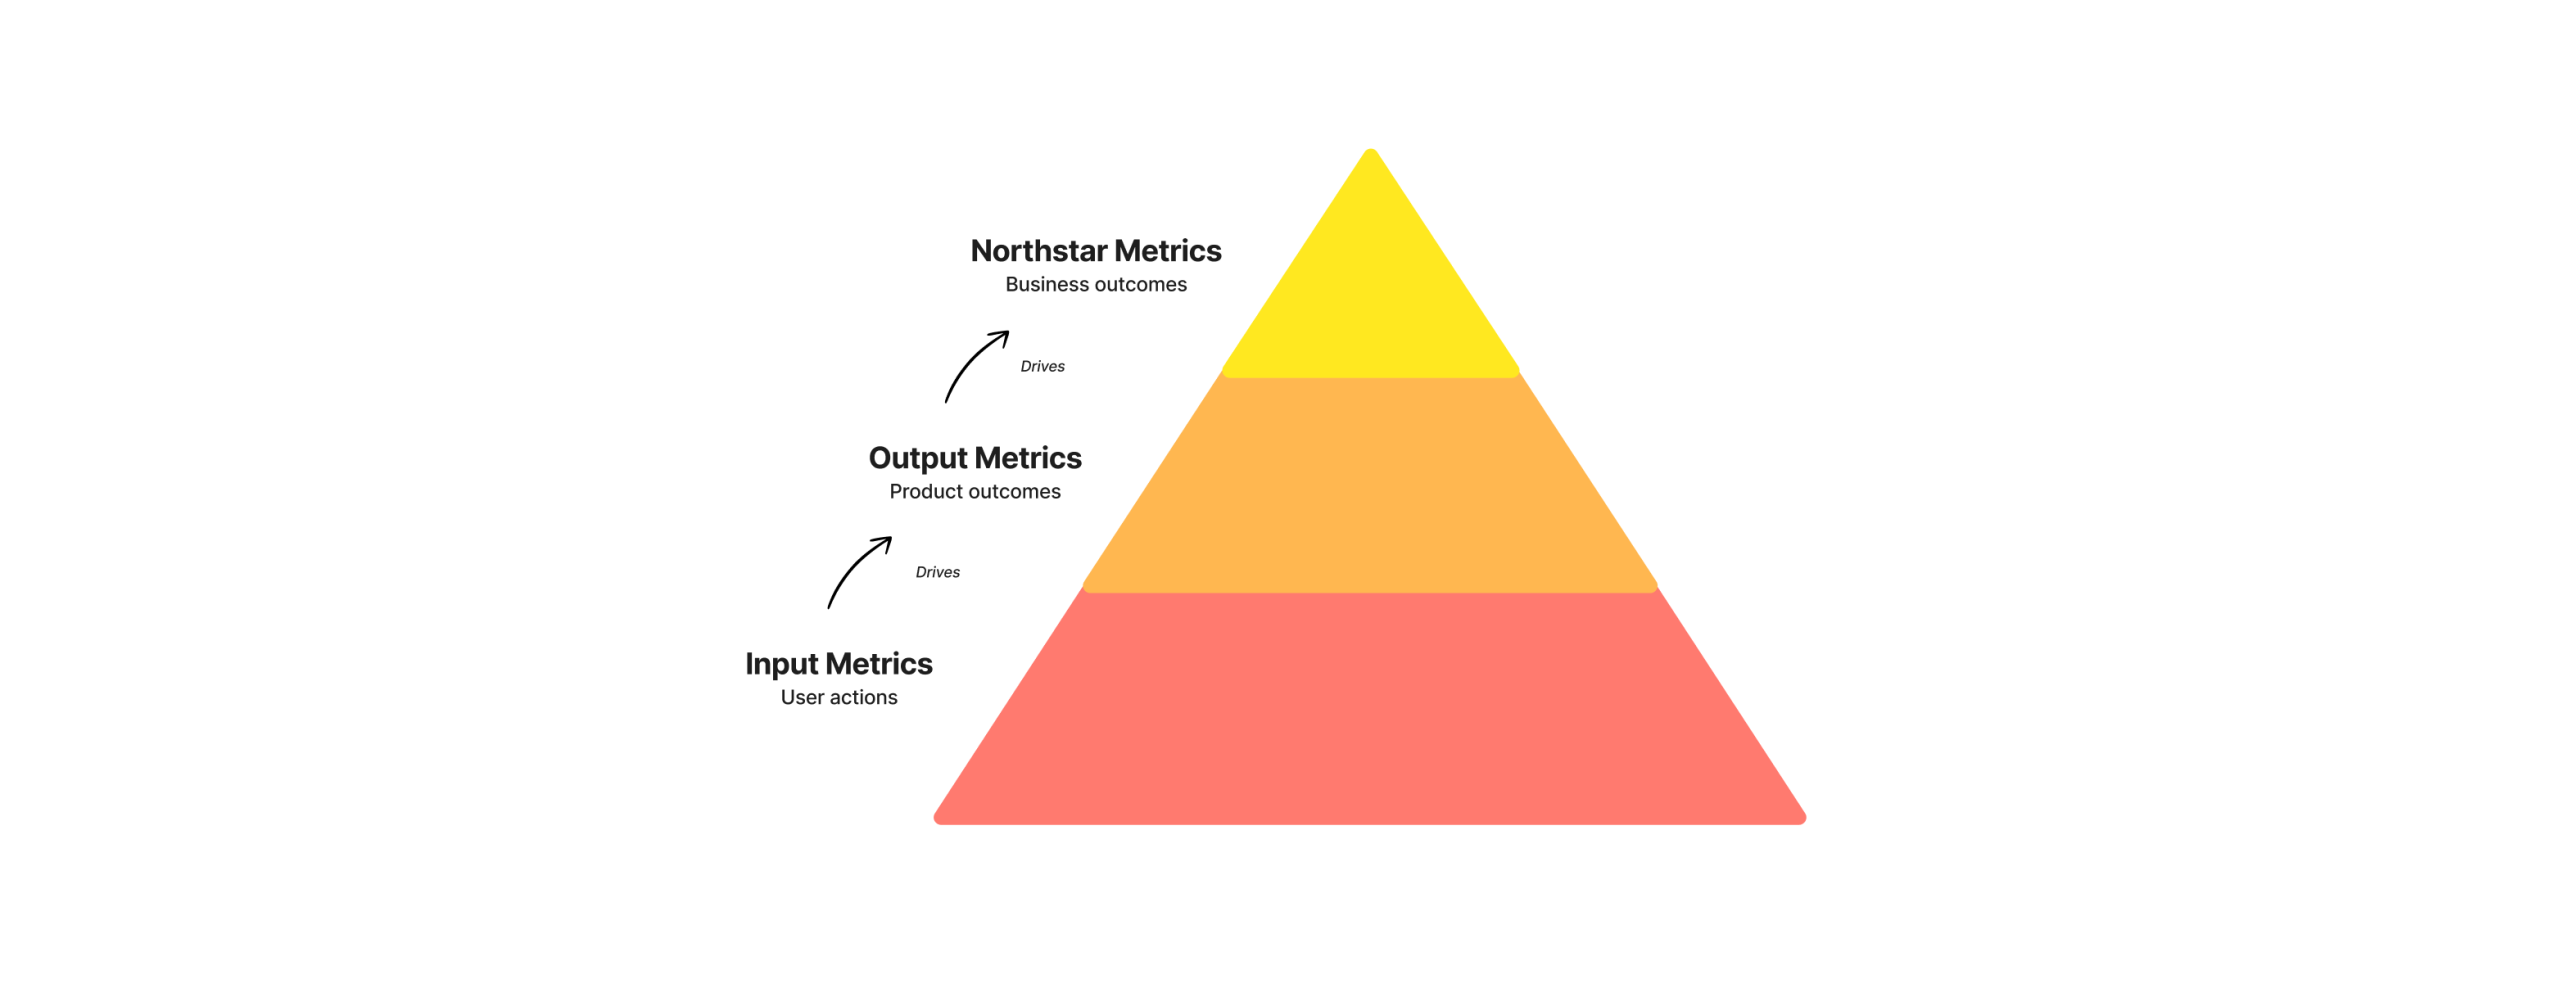
Combining the Three Metrics
Individually, each metric provides insight. Together, they create a powerful evaluation framework.
| Metric | What It Measures | Hidden Insight |
|---|---|---|
| Order Velocity | Demand momentum | Market timing |
| Review Ratio | Customer reality | Product quality |
| Supplier Stability | Fulfillment reliability | Operational risk |
A strong product typically performs well across all three.
The Lifecycle Perspective
Every product follows a lifecycle:
- Introduction
- Growth
- Peak popularity
- Saturation
- Decline
Order volume reflects past success, while velocity reveals lifecycle stage.
Smart sellers aim for late growth or early peak stages — where demand exists but competition has not fully intensified.
Recognizing False Opportunities
Large order numbers sometimes hide poor opportunities.
Warning signs include:
- Massive historical sales but declining reviews
- Heavy discounting trends
- Multiple identical competitors
- Aggressive price wars
These conditions compress margins and reduce differentiation potential.
Identifying Emerging Winners
Look for products showing:
- Rapid review accumulation
- Stable supplier ratings
- Moderate but accelerating order counts
- Consistent pricing
These patterns often precede widespread market adoption.
Using Data Without Overanalyzing
While metrics are powerful, excessive analysis can delay action.
A practical approach:
- Filter by category relevance.
- Check order velocity.
- Verify review ratio.
- Confirm supplier stability.
- Test quickly with small inventory or ads.
Data should guide decisions, not prevent experimentation.
Common Beginner Mistakes
Chasing Only High Orders
This leads to entering overcrowded markets.
Ignoring Supplier Risk
Late shipments damage customer trust more than product flaws.
Misreading Reviews
Focus on patterns rather than isolated complaints.
Copying Viral Products Too Late
By the time products appear everywhere online, margins are often shrinking.
The Psychology Behind Marketplace Data
AliExpress data reflects collective buyer behavior.
High engagement signals emotional resonance:
- Problem-solving value
- Convenience improvement
- Cost efficiency
- Novelty appeal
Understanding buyer motivation adds qualitative insight to quantitative metrics.
Building a Repeatable Selection System
Successful sellers transform research into a consistent process.
Example workflow:
- Weekly category scanning
- Velocity tracking spreadsheet
- Supplier evaluation checklist
- Small-scale testing
- Iterative scaling
Consistency outperforms occasional lucky discoveries.
Long-Term Advantages of Data Literacy
Learning to interpret marketplace signals develops transferable skills:
- Demand forecasting
- Competitive analysis
- Pricing strategy awareness
- Consumer behavior understanding
These abilities remain valuable regardless of platform changes.
Why Data Interpretation Beats Trend Hunting
Trend chasing relies on visibility.
Data interpretation relies on understanding.
The difference determines whether sellers arrive early or late to opportunities.
Those who analyze signals beneath surface numbers consistently discover products before they become obvious.
Frequently Asked Questions
Is high order volume ever enough by itself?
Rarely. It should always be evaluated alongside momentum and supplier reliability.
Can new products succeed with low orders?
Yes, if velocity is increasing quickly.
How often should data be checked?
Weekly monitoring balances awareness with efficiency.
Do these metrics work across all niches?
Yes, though review behavior percentages vary slightly by category.
The Future of Data-Driven Product Selection
As marketplaces grow more competitive, intuitive guessing becomes less reliable.
Accessible data increasingly separates strategic sellers from reactive ones.
Understanding how to interpret signals hidden behind simple metrics allows businesses to make decisions based on evidence rather than assumptions.
Final Thoughts: Seeing Beyond the Numbers
Order volume tells a story — but only part of it.
The real insight comes from understanding how fast orders grow, how buyers respond, and how reliably suppliers operate.
When these three core metrics align, they reveal something powerful: not just what sold yesterday, but what is likely to succeed tomorrow.
By learning to read the patterns beneath AliExpress data, sellers move from imitation to informed decision-making.
And once you begin seeing the truth behind order numbers, product selection stops feeling like gambling and starts becoming a repeatable strategic process.
In eCommerce, success rarely belongs to those who follow the biggest numbers.
It belongs to those who understand what the numbers actually mean.