


 En
En 6 min read
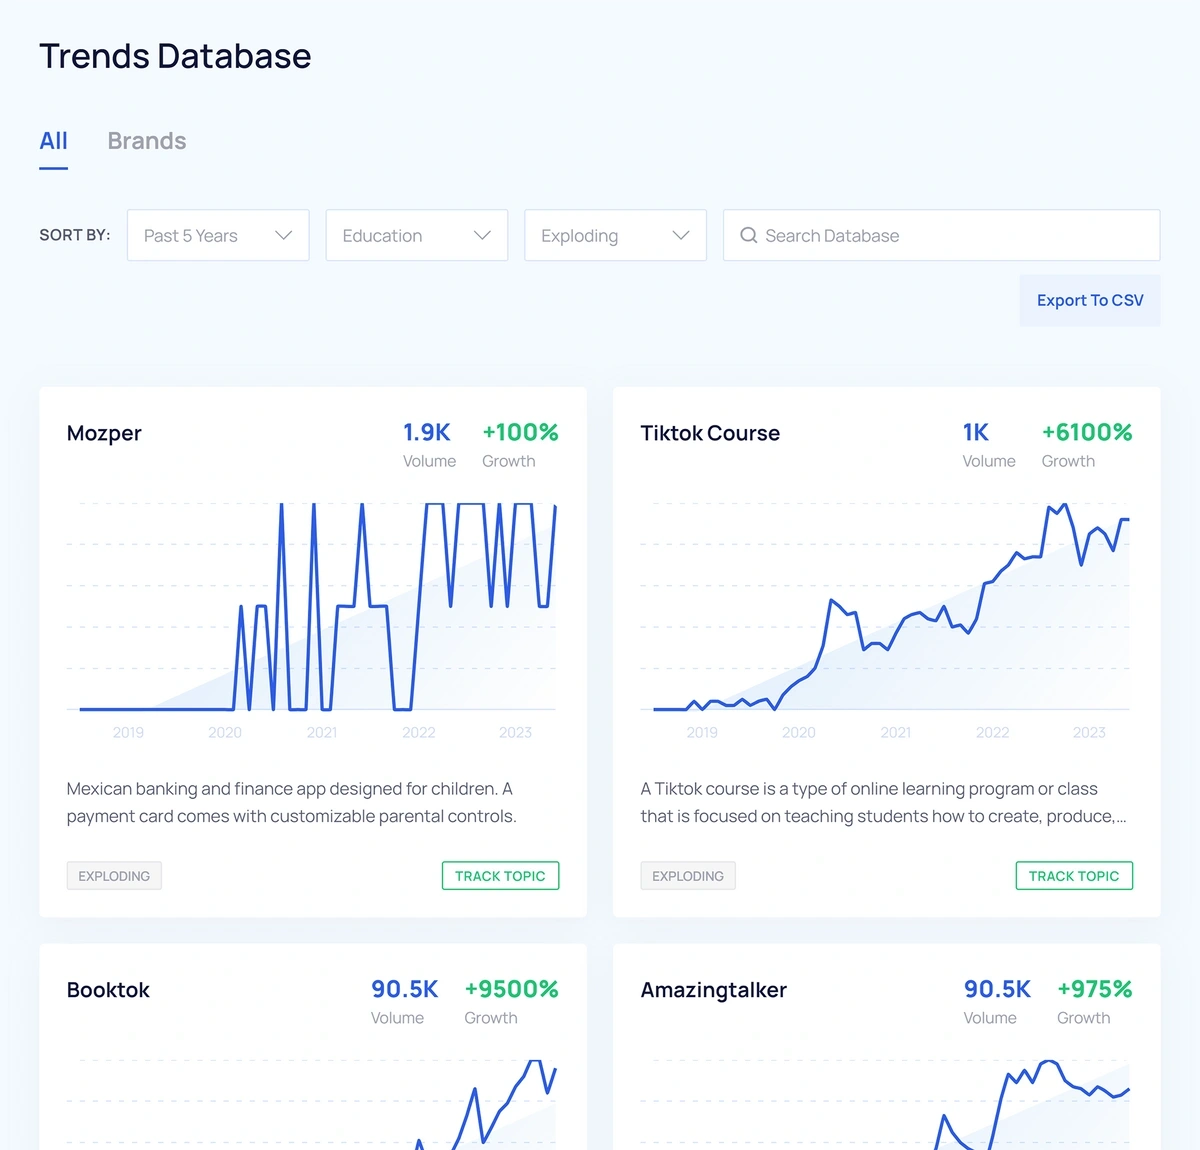
Trend graphs look objective. Clean lines. Time on the X-axis. Demand on the Y-axis. It feels scientific. Yet every year, thousands of sellers confidently jump into products that look promising—only to discover they entered too late, misjudged demand, or mistook noise for growth.
This article will teach you how to actually read trend charts inside product research tools—so you can tell the difference between:
-
Real demand vs temporary hype
-
Sustainable growth vs seasonal spikes
-
Opportunity vs saturation
Once you understand these patterns, you don’t just pick better products—you avoid expensive mistakes.
1. Why Trend Charts Are More Dangerous Than They Look
1.1 Trend Charts Feel Like “Proof”
Trend graphs create a false sense of certainty:
-
“The line is going up”
-
“Search volume is growing”
-
“Everyone is buying this”
But charts don’t show:
-
Who is buying
-
Why demand exists
-
Whether demand will last
A rising line is a question, not an answer.
1.2 The Most Common Trend Chart Mistake
The biggest mistake sellers make is asking:
“Is this trending up?”
Instead, you should ask:
“Why is this trending—and for how long?”
Without context, trend charts can mislead even experienced sellers.
2. Understanding What a Trend Chart Really Measures
2.1 What Most Trend Charts Actually Show
Depending on the tool, trend charts usually reflect:
-
Search volume over time
-
Sales estimates over time
-
Engagement or interest signals
Important: Most charts are proxies, not exact sales numbers.
They show behavior, not revenue.
2.2 Absolute Numbers vs Relative Change
A common trap:
-
Small niche product grows 300%
-
Seller assumes massive opportunity
But:
-
300% of almost nothing is still small
-
Relative growth can hide low absolute demand
Always read:
-
The scale
-
The baseline
-
The actual numbers behind the curve
3. The Five Core Trend Patterns You Must Recognize
3.1 Stable Demand (The “Boring but Profitable” Pattern)
Characteristics:
-
Flat or gently rising line
-
Small fluctuations
-
Long-term consistency
What it means:
-
Predictable demand
-
Lower hype
-
Easier inventory planning
These products rarely go viral—but they quietly build businesses.
3.2 Seasonal Demand (The “Calendar Trap”)
Characteristics:
-
Sharp peaks at the same time every year
-
Long flat periods in between
Examples:
-
Summer outdoor products
-
Holiday decorations
-
Back-to-school items
Key risk:
New sellers mistake seasonal spikes for permanent growth and overstock at the worst time.
3.3 Sudden Spike (The “TikTok Effect”)
Characteristics:
-
Near-zero baseline
-
Explosive short-term growth
-
Often sharp decline
This is usually caused by:
-
Viral videos
-
Influencer mentions
-
News events
Important truth:
By the time trend charts show the spike, early profit is often gone.
3.4 Gradual Uptrend (The “True Opportunity”)
Characteristics:
-
Slow, steady growth over months
-
Minor pullbacks
-
No extreme spikes
This pattern usually signals:
-
Real behavior change
-
Emerging category adoption
-
Long-term potential
These are the trends experienced sellers hunt for.
3.5 Declining Demand (The “Zombie Product”)
Characteristics:
-
Downward slope
-
Lower highs each cycle
-
Shrinking peaks
Danger:
Some tools still label these products as “hot” due to historical data.
Trend charts reveal decay long before sellers admit it.
4. Time Range: The Most Ignored Setting (And the Most Important)
4.1 Why Short Time Frames Lie
Looking at:
-
7 days
-
30 days
…is useful for ads—but dangerous for product decisions.
Short ranges amplify:
-
Noise
-
Promotions
-
Temporary events
They hide long-term reality.
4.2 The Minimum Time Frame for Serious Decisions
For product selection:
-
12 months is the minimum
-
24–36 months is ideal
Long views expose:
-
Seasonality
-
Demand stability
-
Structural growth or decline
If a product “looks great” at 30 days but ugly at 24 months—believe the longer view.
5. Volume + Trend Shape = The Real Signal
5.1 Why Trend Shape Alone Is Meaningless
A clean upward line with:
-
Very low volume
-
Thin market depth
…often means:
-
Fragile demand
-
High volatility
-
Limited scaling potential
5.2 The Sweet Spot
The healthiest signals combine:
-
Medium-to-high baseline volume
-
Gradual upward trend
-
Consistent monthly activity
This suggests:
-
Repeat buyers
-
Broad appeal
-
Sustainable demand
6. How to Separate Hype From Behavior Change
6.1 Ask: What Problem Does This Solve?
Trend charts don’t show motivation.
You must ask:
-
Is this a real pain point?
-
Or entertainment-driven demand?
Products driven by:
-
Convenience
-
Health
-
Safety
-
Cost savings
…tend to last longer than novelty products.
6.2 External Triggers Matter
Sudden trends often rely on:
-
Social media algorithms
-
Platform policy changes
-
Short-lived cultural moments
If demand exists only because of exposure—not necessity—it’s fragile.
7. Comparing Multiple Trend Charts (The Missing Step)
7.1 Don’t Analyze Products in Isolation
Always compare:
-
Primary keyword
-
Related keywords
-
Substitute products
If only one keyword is growing while related terms are flat, growth may be artificial.
7.2 Category-Level Trends vs Product-Level Trends
A strong product inside a declining category is risky.
A decent product inside a growing category is often safer.
Zoom out before zooming in.
8. Trend Charts and Competition: Read Them Together
8.1 Rising Demand + Rising Sellers = Margin Pressure
If trend charts show:
-
Demand increasing
-
Seller count exploding
Expect:
-
Price competition
-
Higher ad costs
-
Lower margins
8.2 Flat Demand + Stable Competition Can Still Win
Some of the most profitable niches:
-
Aren’t growing fast
-
Aren’t exciting
-
Aren’t crowded
Stability is underrated.
9. Common Misinterpretations That Cost Sellers Money
-
Confusing spikes with trends
-
Ignoring seasonality
-
Trusting short-term charts
-
Overestimating growth rates
-
Assuming trends equal profits
Trend charts don’t lie—but they don’t explain themselves either.
10. A Practical Checklist for Reading Trend Charts
Before choosing a product, ask:
-
What time range am I viewing?
-
Is demand consistent or episodic?
-
What caused growth?
-
Is volume meaningful?
-
How does competition react to the trend?
-
Can this demand survive six months from now?
If you can’t answer these confidently, wait.
Final Thoughts: Trend Charts Are Warnings, Not Guarantees
Trend charts are not green lights.
They are early warning systems:
-
Warning you of hype
-
Warning you of decline
-
Warning you of false confidence
Sellers who lose money don’t lack tools.
They lack interpretation.
Once you learn to read trend charts correctly, you stop chasing excitement—and start building decisions based on reality.
And that’s when product research stops feeling like gambling.
0