


 En
En 10 min read
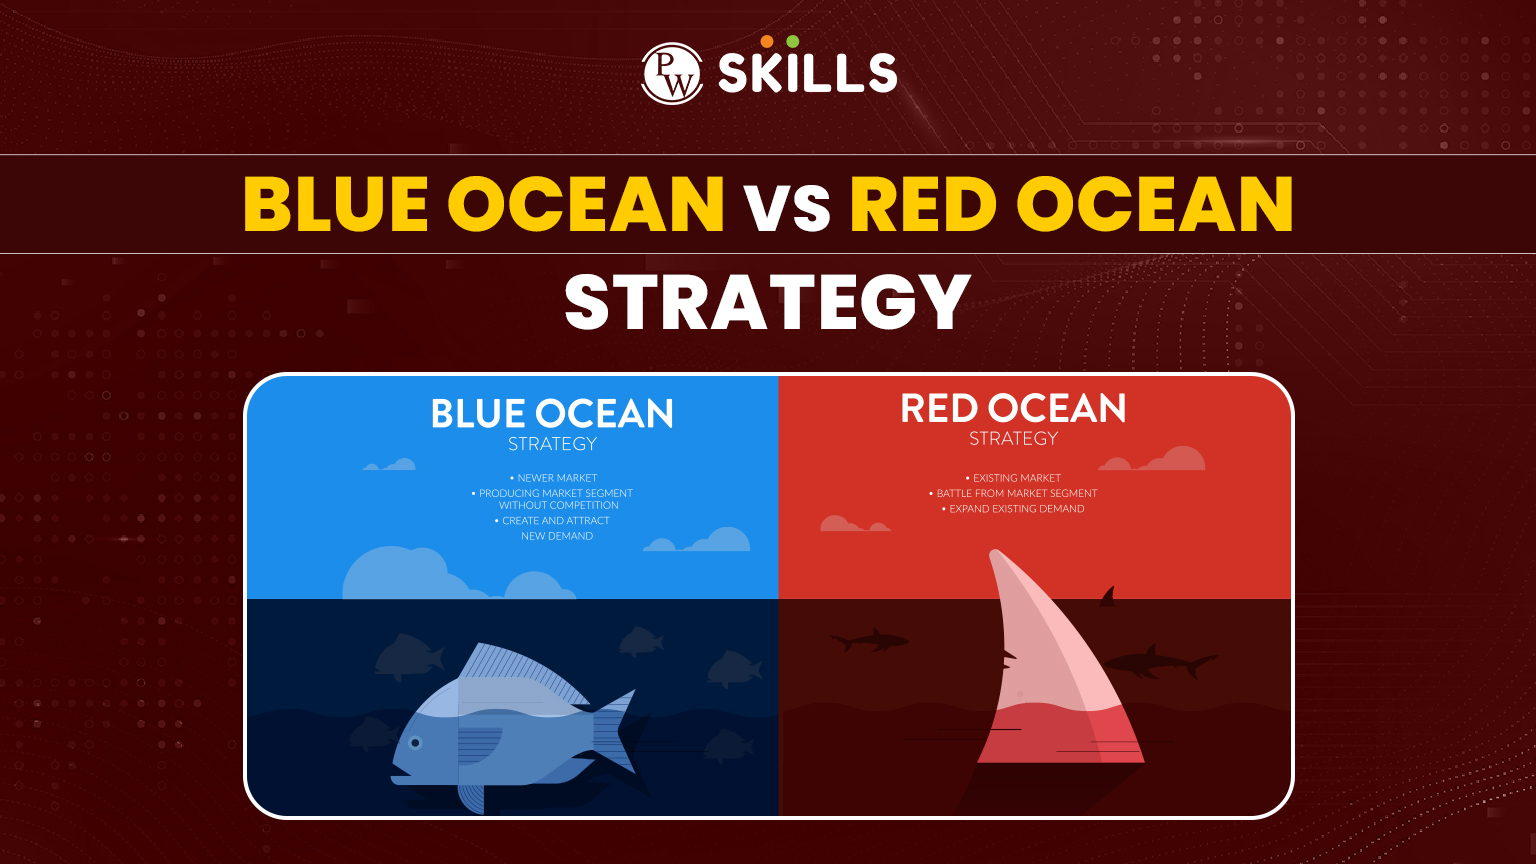
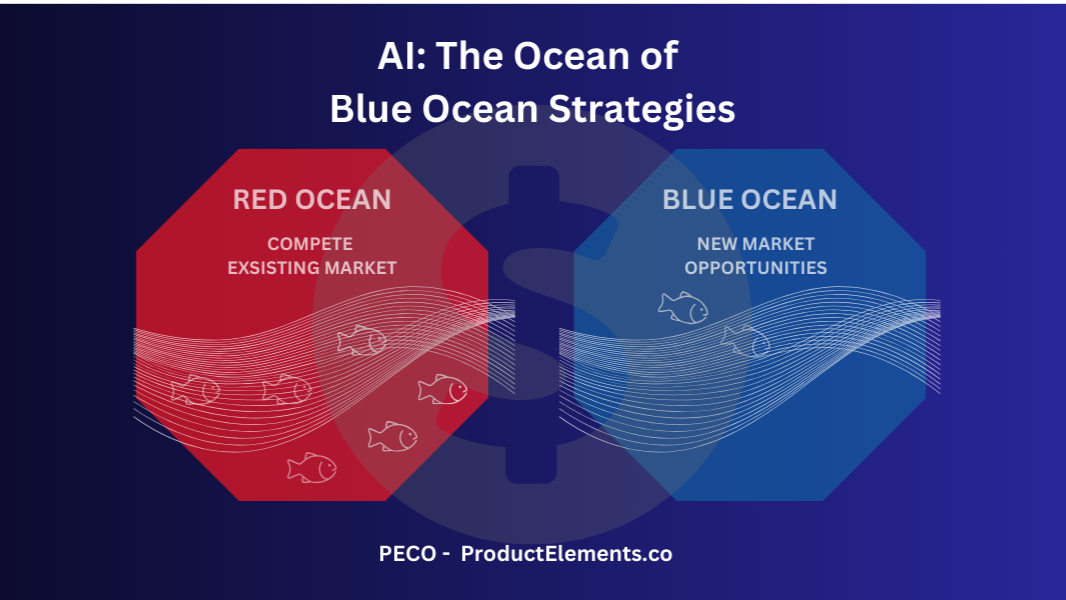
In the world of product development and e-commerce, few phrases are as appealing as “blue ocean product.” The term refers to products that enter markets with low competition, strong demand, and significant room for growth. Unlike “red ocean” markets—crowded spaces where competitors fight aggressively for the same customers—blue ocean opportunities offer breathing room for innovation and expansion.
However, identifying a genuine blue ocean product is far more complicated than it sounds. Many entrepreneurs rely on intuition, trends, or viral product videos when choosing what to sell. While these signals can be helpful, they often lead to crowded markets within weeks.
The reality is simple: data provides the most reliable clues about whether a product truly has blue ocean potential.
Instead of guessing, successful product researchers analyze specific metrics that reveal how a market behaves. These numbers expose hidden opportunities, highlight risks, and help determine whether a product category has room for sustainable growth.
This article breaks down five essential metrics that can help identify products with strong potential in emerging or underserved markets. Understanding these indicators allows businesses to make smarter decisions and avoid entering markets that are already saturated.
Understanding the Blue Ocean Concept
Before diving into the metrics, it is important to clarify what defines a blue ocean product.
A blue ocean market typically has several characteristics:
-
Relatively low competition
-
Untapped or underserved demand
-
Clear product differentiation opportunities
-
Strong long-term growth potential
This does not necessarily mean that no competitors exist. Instead, it means that the market is not yet overcrowded, and new entrants can still capture meaningful share.
Many successful product categories began as blue oceans before becoming highly competitive. Early electric toothbrushes, ergonomic office furniture, and smart home devices all followed this trajectory.
The challenge for product researchers is identifying these opportunities before the market becomes saturated.
That is where data becomes essential.
Metric 1: Search Demand Growth
One of the most powerful indicators of product potential is search demand growth.
Search demand reflects how often people look for a product or related solutions online. When search volume increases steadily over time, it often signals growing consumer interest.
However, raw search numbers alone are not enough. What matters more is the trend direction.
What to Look For
An ideal blue ocean product often shows:
-
Consistent upward search trends over several months or years
-
Moderate current search volume with clear growth potential
-
Increasing search interest in multiple regions
Rapid spikes followed by sharp drops may indicate temporary hype rather than sustainable demand.
Steady growth, on the other hand, suggests that consumers are gradually discovering and adopting a new product category.
Why This Matters
Search behavior reveals what consumers are actively curious about. When thousands of people begin searching for solutions to a specific problem, it indicates that a market may be forming.
Companies that enter during this growth phase often gain an advantage before competition intensifies.
Metric 2: Competition Density
Demand alone does not define a blue ocean opportunity. A product may be popular, but if hundreds of established brands already dominate the space, entering the market becomes extremely difficult.
Competition density measures how crowded a product category is.
Evaluating Market Saturation
Several signals help determine competition levels:
-
Number of sellers offering similar products
-
Market share concentration among top brands
-
Advertising intensity
-
Similarity of product listings
In saturated markets, new sellers must compete on price or spend heavily on marketing just to gain visibility.
In contrast, emerging markets often show fragmented competition with smaller brands and fewer dominant players.
Finding the Balance
The best blue ocean opportunities usually fall in a middle zone:
-
Enough competitors to confirm demand
-
Few dominant brands controlling the market
This balance indicates that the category is real but still open to innovation.
Metric 3: Review Volume Distribution
Customer reviews provide valuable insights into product maturity.
In highly competitive markets, top products often accumulate thousands or even tens of thousands of reviews. This creates a powerful barrier to entry for new brands.
But in emerging product categories, review counts tend to be more evenly distributed among sellers.
What to Analyze
Look at the number of reviews across the first few pages of product listings.
A promising blue ocean pattern might look like this:
-
Top products with moderate review counts
-
Newer listings gaining traction quickly
-
No single product dominating the category
This suggests that the market is still evolving.
Why It Matters
Reviews represent both trust and historical sales. When one product holds an overwhelming review advantage, new competitors may struggle to gain credibility.
Balanced review distribution indicates that customers are still exploring options.
Metric 4: Price Stability and Profit Margin
A market with strong demand and low competition should also offer healthy profit potential.
One way to evaluate this is by analyzing price stability.
Indicators of a Healthy Market
A promising category typically shows:
-
Relatively stable pricing across sellers
-
Clear differentiation between budget and premium products
-
Reasonable margins after accounting for costs
If prices drop rapidly due to intense competition, profit potential may disappear quickly.
Avoiding Price Wars
Price wars are common in saturated markets where sellers offer nearly identical products. This often leads to a race to the bottom where profitability declines for everyone.
Blue ocean products, by contrast, usually allow sellers to maintain stable prices because differentiation still exists.
Metric 5: Problem-Solution Fit
Perhaps the most important metric of all is problem-solution alignment.
Successful products solve real problems. When customers repeatedly search for solutions, ask questions in forums, or leave detailed feedback about specific frustrations, it reveals unmet needs.
Signals of Strong Problem Demand
Look for evidence such as:
-
Frequently asked customer questions
-
Negative reviews mentioning unresolved issues
-
Online discussions about workarounds or improvements
These signals indicate that the market is not yet fully satisfied.
Opportunity for Innovation
Blue ocean products often emerge when a company introduces a better solution to a problem that existing products address poorly.
This improvement may involve:
-
Better design
-
Improved durability
-
Enhanced convenience
-
Additional functionality
When product innovation directly addresses user frustrations, adoption can accelerate quickly.
Combining the Five Metrics
Individually, each metric provides useful insights. But the most powerful analysis comes from combining them.
A product with strong blue ocean potential often displays the following pattern:
-
Growing search demand
-
Moderate competition density
-
Balanced review distribution
-
Stable pricing and healthy margins
-
Clear evidence of unresolved customer problems
When all five signals align, the probability of market opportunity increases significantly.
Common Mistakes in Product Research
Many new entrepreneurs overlook data-driven analysis and fall into common traps.
Chasing Viral Trends
Social media trends can create temporary spikes in product popularity. However, these spikes often fade quickly.
Without sustained demand, viral products rarely become long-term businesses.
Ignoring Market Saturation
A product may appear attractive until competition data reveals hundreds of similar listings.
Entering such markets without differentiation can be extremely difficult.
Overlooking Customer Feedback
Reviews and user discussions contain valuable insights about what customers actually want.
Ignoring this feedback may lead to launching products that fail to address real needs.
Why Data-Driven Product Selection Matters
Choosing the right product is one of the most important decisions in any e-commerce business.
Launching in a crowded market often requires massive marketing budgets and aggressive pricing strategies. Even then, success is not guaranteed.
By contrast, identifying an emerging category early allows businesses to:
-
Establish brand recognition
-
Build customer trust
-
Refine product design before competitors arrive
Data analysis dramatically improves the chances of finding these opportunities.
The Role of Creativity in Blue Ocean Strategy
While data reveals opportunities, creativity plays an equally important role.
Sometimes the best blue ocean products do not involve completely new inventions. Instead, they improve existing products in meaningful ways.
Examples of innovation might include:
-
Simplifying complex designs
-
Improving durability or reliability
-
Enhancing aesthetics or ergonomics
-
Combining multiple functions into one product
When creativity meets data-driven insights, new market spaces often emerge.
Long-Term Thinking in Product Strategy
Even the most promising blue ocean market will eventually attract competition.
As more sellers enter the space, pricing pressure increases and differentiation becomes more important.
Businesses that succeed in the long term typically focus on:
-
Continuous product improvement
-
Strong brand identity
-
Customer loyalty and service quality
The goal is not only to discover a blue ocean—but also to build a lasting presence within it.
Final Thoughts
The idea of finding the next blue ocean product is exciting, but it should never rely on guesswork alone. Markets evolve quickly, and intuition without data can easily lead businesses into crowded and highly competitive spaces.
By analyzing key metrics such as search demand growth, competition density, review distribution, price stability, and problem-solution alignment, product researchers gain a clearer picture of where real opportunities exist.
These indicators reveal patterns that are often invisible at first glance. They show where consumer demand is rising, where competition is still manageable, and where innovation can truly make a difference.
In product development and e-commerce, success rarely comes from luck. More often, it comes from careful observation, thoughtful analysis, and the willingness to follow what the data reveals.
Because in the end, data doesn’t lie—and when interpreted correctly, it can point directly toward the next great market opportunity.